 Global| May 04 2007
Australia Trade Deficit Increases in March, But Exports of Raw Materials Help Cover Machinery Imports
Summary
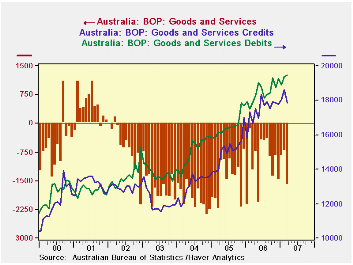
Australia's balance of trade in goods and services moved further into deficit in March as exports declined and imports continued increasing. The overall deficit was A$1,622 million, up from A$728 million in February (seasonally [...]

Australia's balance of trade in goods and services moved further into deficit in March as exports declined and imports continued increasing. The overall deficit was A$1,622 million, up from A$728 million in February (seasonally adjusted). The year-ago figure was A$1,241 million.
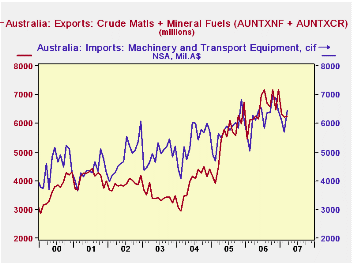
Australia is a mineral-rich economy. It exports substantial amounts of so-called "crude materials" and has extensive two-way trade in "mineral fuels", running a surplus in that category. (These are SITC commodity groups.) So Australia actually derives some benefit from recent rising oil and commodity prices. See in the table below, where we have added together the exports of these raw materials. They now basically pay for the country's biggest imports, machinery and transport equipment.
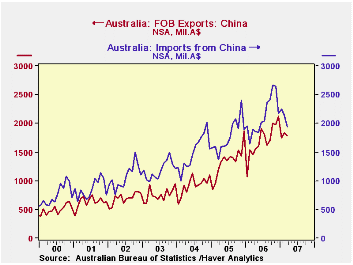
Another distinction the mineral resources bring to Australia's trade is the existence of a relatively moderate deficit in trade with China. In 2006, this was A$5.1 billion, or just A$425 million per month; the first three months this year have averaged A$324 million. While trade data by country and commodity are not available to us, it would seem that a good share of Australia raw materials would go to China, covering much of what we assume would be imports of consumer goods.
In contrast, the country runs a sizable deficit with the United States. Exports to the US totaled just over A$10 billion last year and averaged A$757 million the first three months this year. Imports, though, were A$24.5 billion in 2006 and averaged just under A$2 billion a month during Q1 this year. Australia also carries a noticeable deficit with Europe. We assume that the US and Europe are sources for a good portion of its machinery imports. In sharp contrast, Australia runs significant surpluses with Japan and Korea, again, we'd guess as a provider for some of their raw material needs.
| AUSTRALIA (Mil.A$) | Mar 2007 | Feb 2007 | Jan 2007 | Mar 2006 | Monthly Averages|||
|---|---|---|---|---|---|---|---|
| 2006 | 2005 | 2004 | |||||
| Balance on Goods & Services | -1,622 | -728 | -843 | -1,241 | -979 | -1,399 | -1,985 |
| Credits (Exports) | 17,839 | 18,632 | 18,066 | 16,650 | 17,454 | 15,078 | 13,103 |
| Debits (Imports) | 19,461 | 19,360 | 18,909 | 17,891 | 18,432 | 16,477 | 15,087 |
| Goods Balance: China (NSA) | -158 | -312 | -502 | -431 | -425 | -436 | -576 |
| USA (NSA) | -1,428 | -963 | -1,291 | -1,241 | -1,198 | -1,011 | -915 |
| Raw Material Exports* (NSA) | 6,250 | 6,226 | 6,318 | 6,136 | 6,533 | 5,475 | 3,908 |
| Machinery Imports (NSA) | 6,448 | 5,682 | 6,095 | 6,277 | 6,237 | 5,745 | 5,353 |
Carol Stone, CBE
AuthorMore in Author Profile »Carol Stone, CBE came to Haver Analytics in 2003 following more than 35 years as a financial market economist at major Wall Street financial institutions, most especially Merrill Lynch and Nomura Securities. She has broad experience in analysis and forecasting of flow-of-funds accounts, the federal budget and Federal Reserve operations. At Nomura Securites, among other duties, she developed various indicator forecasting tools and edited a daily global publication produced in London and New York for readers in Tokyo. At Haver Analytics, Carol is a member of the Research Department, aiding database managers with research and documentation efforts, as well as posting commentary on select economic reports. In addition, she conducts Ways-of-the-World, a blog on economic issues for an Episcopal-Church-affiliated website, The Geranium Farm. During her career, Carol served as an officer of the Money Marketeers and the Downtown Economists Club. She has a PhD from NYU's Stern School of Business. She lives in Brooklyn, New York, and has a weekend home on Long Island.


