 Global| Mar 15 2007
February Eurozone HICP Holds at 1.8% Yr/Yr; Core Picks Up to 1.9% with Widespread Gains
Summary
Consumer prices in the Eurozone rose 1.8% in February from a year ago, the same as in January and 0.1% below December. In February 2006, the year-on-year change was 2.3%, boosted by strong energy gains. In the most recent months, [...]

Consumer prices in the Eurozone rose 1.8% in February from a year ago, the same as in January and 0.1% below December. In February 2006, the year-on-year change was 2.3%, boosted by strong energy gains.
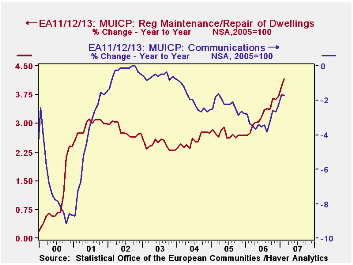
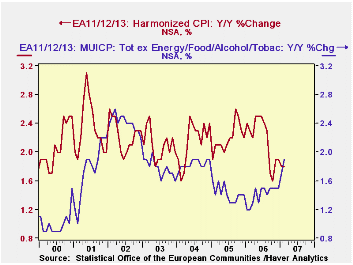
In the most recent months, energy prices have slowed, as is well known. But a version of a "core" HICP has picked up. A year ago, when energy was running rampant, the index less energy and food/alcohol/tobacco was very slow at 1.2% year-on-year. Now, this core rate has picked up to 1.7% in January and 1.9% in February. Several sectors are participating: clothing prices in particular have stopped falling. While rising only about 1%, they have turned around from earlier outright declines. Household maintenance and repairs have gained, as well as home furnishings and housekeeping products. Health care costs are rising this year. There have been modest accelerations of education costs, hotels and restaurants and "other". Communications prices are still falling, but much less than they had been.
So while both the total HICP and this core measure are hovering below the ECB's comfort rate of 2%, the breadth of the price increases is opening up concern over inflation. Over the last 15 months, the ECB has raised its target rate seven times, most recently on March 8 to 3.75%. [This is the minimum bid rate for conducting refinancing operations at the Bank.]
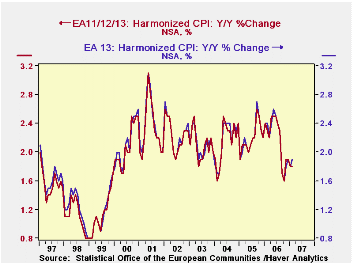
Note that these price data cover series denoted in Haver's databases as "EA11/12/13". This grouping includes the new members of the Monetary Union only as they join, not earlier. Prior to 2001, there were 11 members; Greece was added then and finally Slovenia just this year. The data are not "break adjusted", as is an alternative series, which we call EA13 and which includes Greece and Slovenia since the beginning of these data in 1996. As seen in the accompanying graph, there is hardly any visible difference in the groupings. But there are small differences in individual periods: for instance, the "headline rate" for EA11/12/13 this month is 1.8%, but the comparable EA 13 figure is 1.9%.
| EA11/12/13 Yr/Yr % Changes | Feb 2007 | Jan 2007 | Dec 2006 | Year Ago | December/December|||
|---|---|---|---|---|---|---|---|
| 2006 | 2005 | 2004 | |||||
| HICP [MUICP] | 1.8 | 1.8 | 1.9 | 2.3 | 1.9 | 2.2 | 2.4 |
| Energy | 0.8 | 0.9 | 2.9 | 12.6 | 2.9 | 11.3 | 6.9 |
| Ex Energy, Food/- Alcohol/Tobacco | 1.9 | 1.7 | 1.5 | 1.2 | 1.5 | 1.4 | 1.9 |
| Memo: EA 13 | 1.9 | 1.8 | 1.9 | 2.4 | 1.9 | 2.2 | 2.4 |
Carol Stone, CBE
AuthorMore in Author Profile »Carol Stone, CBE came to Haver Analytics in 2003 following more than 35 years as a financial market economist at major Wall Street financial institutions, most especially Merrill Lynch and Nomura Securities. She has broad experience in analysis and forecasting of flow-of-funds accounts, the federal budget and Federal Reserve operations. At Nomura Securites, among other duties, she developed various indicator forecasting tools and edited a daily global publication produced in London and New York for readers in Tokyo. At Haver Analytics, Carol is a member of the Research Department, aiding database managers with research and documentation efforts, as well as posting commentary on select economic reports. In addition, she conducts Ways-of-the-World, a blog on economic issues for an Episcopal-Church-affiliated website, The Geranium Farm. During her career, Carol served as an officer of the Money Marketeers and the Downtown Economists Club. She has a PhD from NYU's Stern School of Business. She lives in Brooklyn, New York, and has a weekend home on Long Island.


