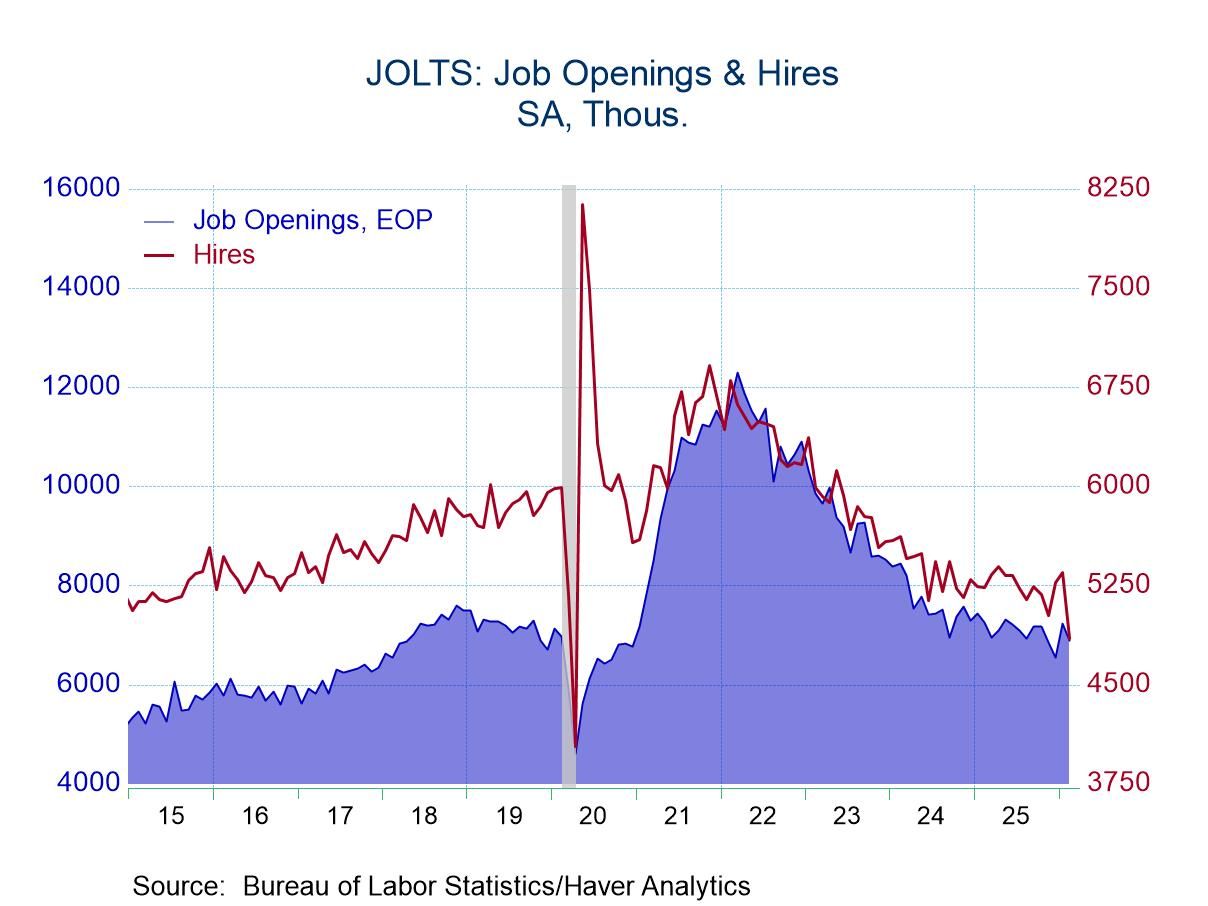
- Openings fell 4.9% m/m to 6.882 million from an upwardly revised 7.240 million in January.
- Hiring plummeted 9.3% m/m to 4.849 million, the lowest reading since April 2020.
- Separations fell 3.4%% m/m to 4.971 million with a decline in Quits and an increase in Layoffs.
USA| Mar 31 2026
U.S. JOLTS: Openings and Hiring Fell in February
by:Sandy Batten
|in:Economy in Brief
More Commentaries
 France| Mar 27 2026
France: INSEE MFG Weakens as Inflation Expectations Surge
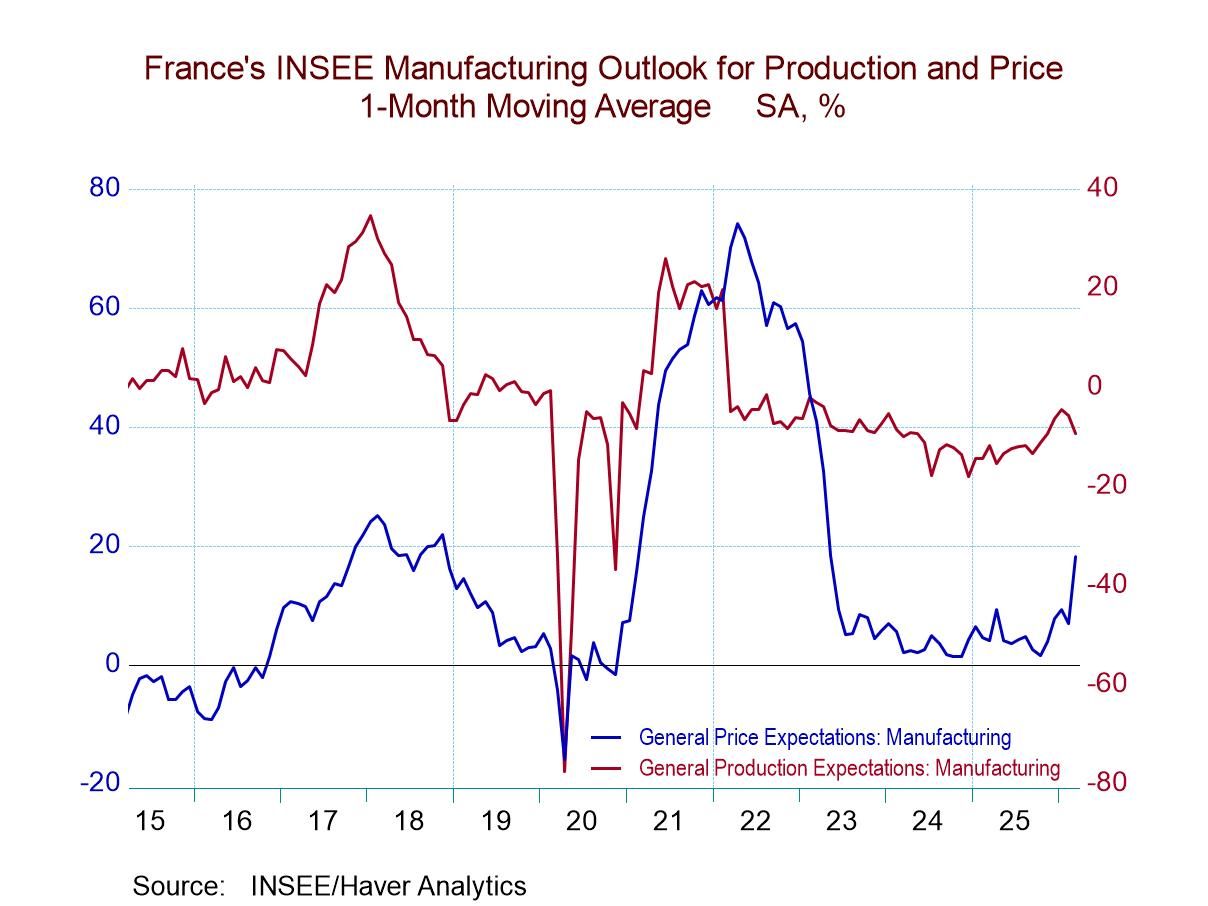
French manufacturing, as assessed by the INSEE survey, fell sharply to a reading of 98.7 in March from February’s 101.7. The industrial sector reading weakened further, having already fallen to 101.7 in February from 105.4 in January. The January reading was the strongest reading since July 2022, as the rebound from COVID had gathered momentum.
Now, events in the Middle East, a dragged-out war in Ukraine, and a long period of inadequate growth in the wake of COVID, and the imposition of Tariffs by the United States are taking a toll on an economy less able to absorb shocks.
Just as inflation had settled down, there is a new oil shock in progress, a result of the attack in Iran, meant to defang it from its nuclear obsessions and its ambitions to dominate geopolitics in the Middle East by supporting various regional militia groups. The European Central Bank had corralled inflation more than controlled it, but now the ECB is more worried about oil and its impact on inflation and is determined not to make ‘the same mistake again’ referring to its procrastinated timeline for raising rates during COVID. Both the BOE and the ECB have said if the war is still in progress at the time of their next meetings, a rate hike is likely.
So, in several ways, it is a different world. In the United States, it is the same old world as the Fed has been uncommunicative about its strategy in the face of war and rising energy prices. The Fed has offered essentially no guidance. But the ECB and BOE have made clear they are not waiting on the Fed this time around.
The French economy’s main industrial indicator has a 25-percentile standing in March, a lower one-quartile ranking. Production expectations slipped to -9.4 in March from -5.7 in February, corresponding to a 37.5 percentile standing. The recent trend and own industrial likely trend both eased on the month, with the overall trend to 23.4 percentile standing and the personal likely trend to a still-above-median 50.9 percentile standing. Industrial respondents see the overall manufacturing situation as worse than their own personal prospect. Is that denial in action or excessive macroeconomic pessimism? That is something to watch for.
Orders and demand as well as foreign orders and demand fell in March. They had also fallen in February relative to January. The March readings show a 40.9 percentile standing for orders and demand against a slightly higher 47.8 percentile standing for foreign orders and demand.
The price survey news is bad. Both the own likely price trend and the manufacturing price level are higher in March and had already moved higher in February relative to January. The price expectations rank in the 74.9 percentile for own likely price trend and at the 66.3 percentile for the manufacturing price level.
 Global| Mar 26 2026
Charts of the Week: A Supply-Constrained World Comes into Sharper Focus
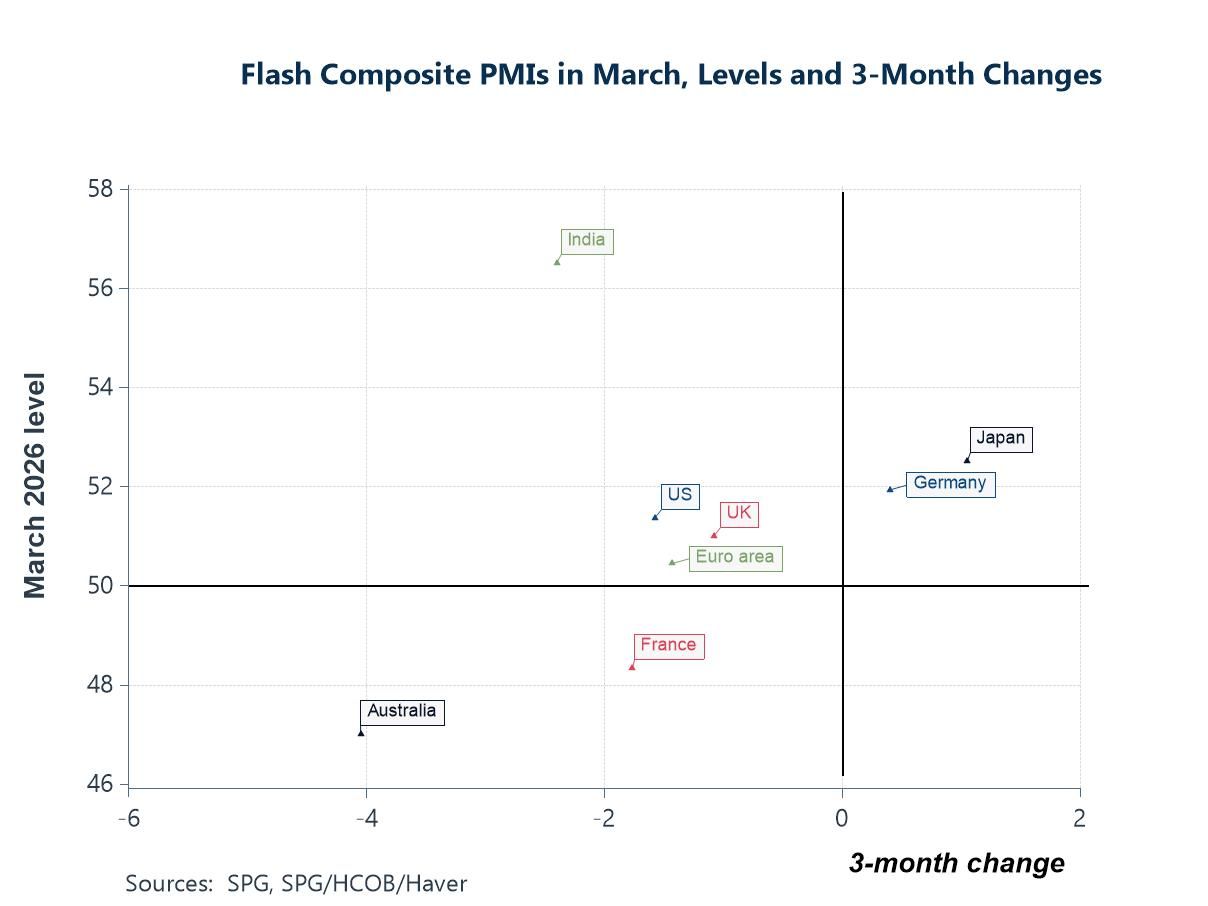
Recent de-escalation signals in the Middle East have offered some relief to markets, but the economic aftershocks from the earlier escalation are still feeding through—particularly via energy prices and heightened geopolitical risk. Crucially, these shocks are not hitting a clean cyclical backdrop. Instead, they are amplifying a set of pre-existing supply-side pressures—fragmented trade, strained supply chains, and a more complex policy environment—that have been building for some time. The charts this week pick up that theme. Forward-looking sentiment indicators suggest global growth has lost some momentum, even if activity remains in expansion territory (chart 1). At the same time, broader measures of uncertainty remain elevated (chart 2), while supply chain stress is once again moving higher, reinforcing the idea that disruption is becoming more structural (chart 3). Financial markets are reflecting this shift, with increased uncertainty around the future path of policy rates (chart 4), and survey evidence pointing to a more fundamental challenge around the credibility and transmission of monetary policy itself (chart 5). And yet, there are some offsets. Despite the recent spike in oil prices, medium-term inflation expectations—at least in the US—remain relatively well anchored (chart 6). Even so, the overall message is one of a more fragile, supply-driven cycle—where shocks like the Middle East do not just disrupt the outlook, but intensify the underlying constraints shaping the global economy.
by:Andrew Cates
|in:Economy in Brief

- New claims rose by 5,000 to 210,000.
- Continuing claims declined by 32,000 to 1.819 million, the lowest level for insured unemployment since May 25, 2024.
- The insured unemployment rate remained at 1.2%.
 Global| Mar 26 2026
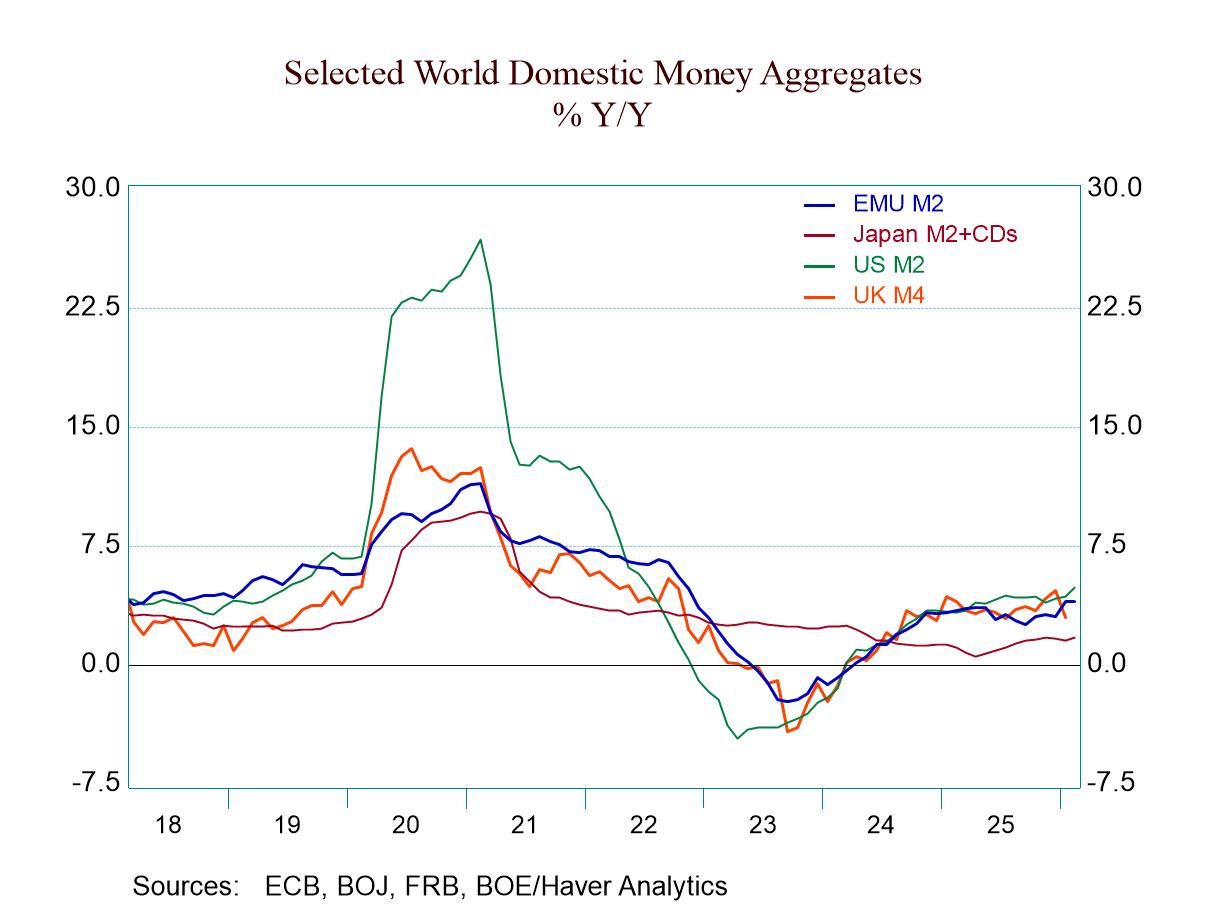
Globally Money Supplies Retain Hot Growth
Current global money and credit trends Money supply growth accelerated in February over three months compared to six months in the United States and the United Kingdom. In the EMU, money growth backed down from a 6.3% growth rate over six months to a still hot 5.6% over three months. Japan, as always, was the exception, with money growth sinking to a weak 1.5% over three months from 2.1% over six months. And the Bank of Japan still has its sights on raising rates further and bringing the level of interest rates eventually to a normalized level. In the EMU, credit growth accelerated as private credit grew at a 5.4% pace over three months, up from 5.1% over six months.
Excessive money growth: Money and credit growth are excessive compared to what would seem to be equilibrium conditions. Those conditions right now have economic growth weak, in the region of 1% to 2%, and monetary targets are 2% all around. All of them are being exceeded—at least in terms of core inflation rates.
 USA| Mar 25 2026
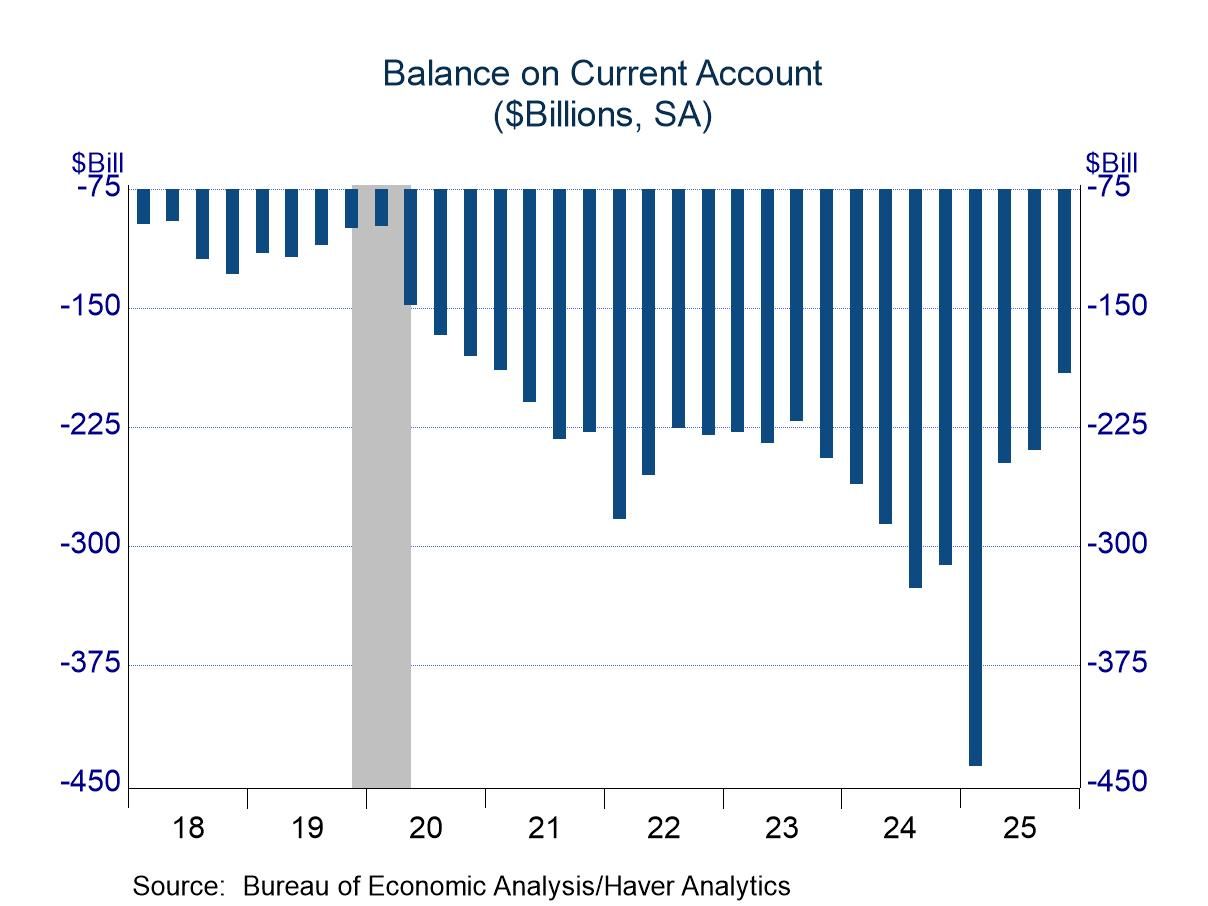
Current Account: Notable Improvement in Q4
- Firm exports boosted the trade component.
- Primary income flows rebounded from soft showings in prior quarters.
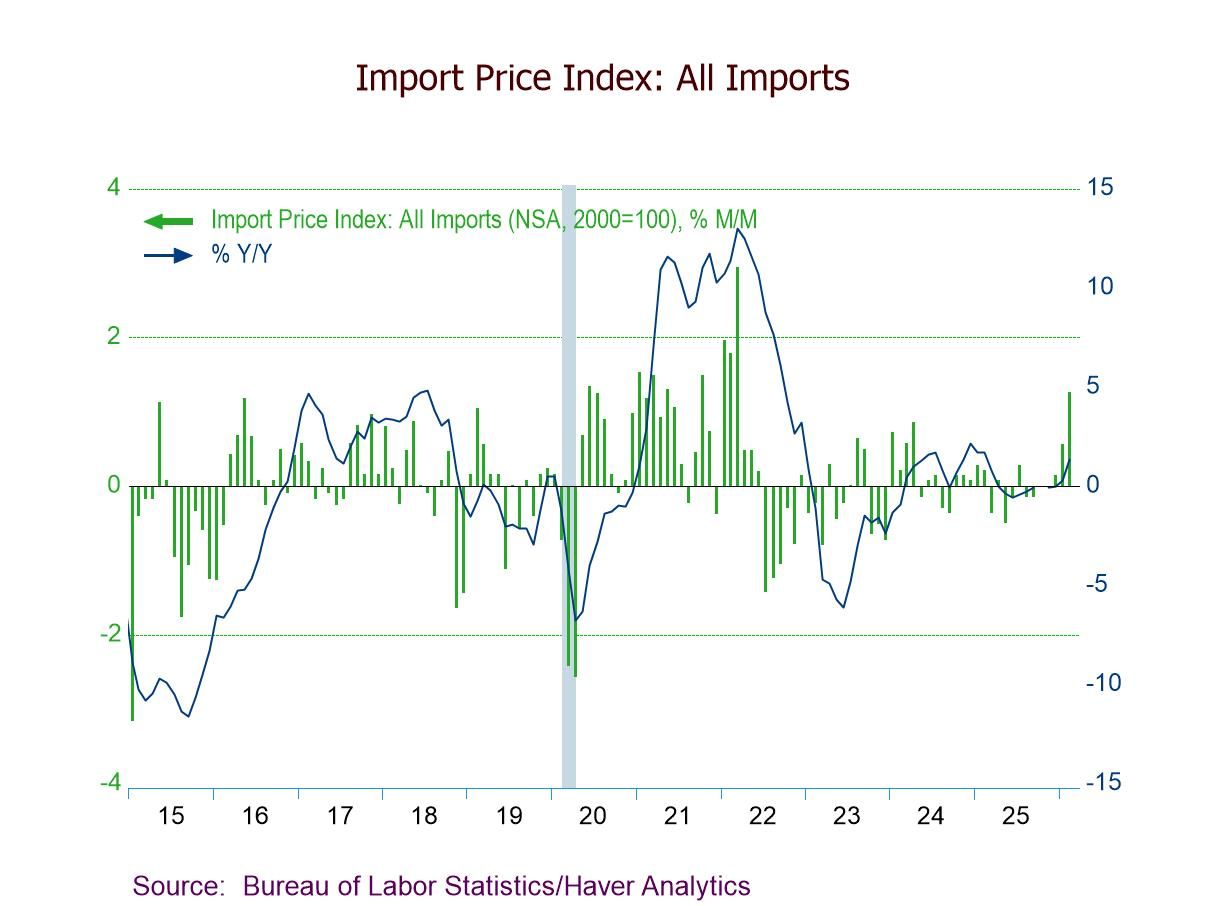
- Import prices +1.3% m/m (+1.3% y/y) in Feb., led by a 3.8% rebound in fuel import prices.
- Excluding fuels, import prices +1.1% m/m (+2.5% y/y) after a 0.8% Jan. increase.
- Export prices +1.5% m/m (+3.5% y/y), driven by a 1.7% gain in nonagricultural exp. prices.
 USA| Mar 25 2026
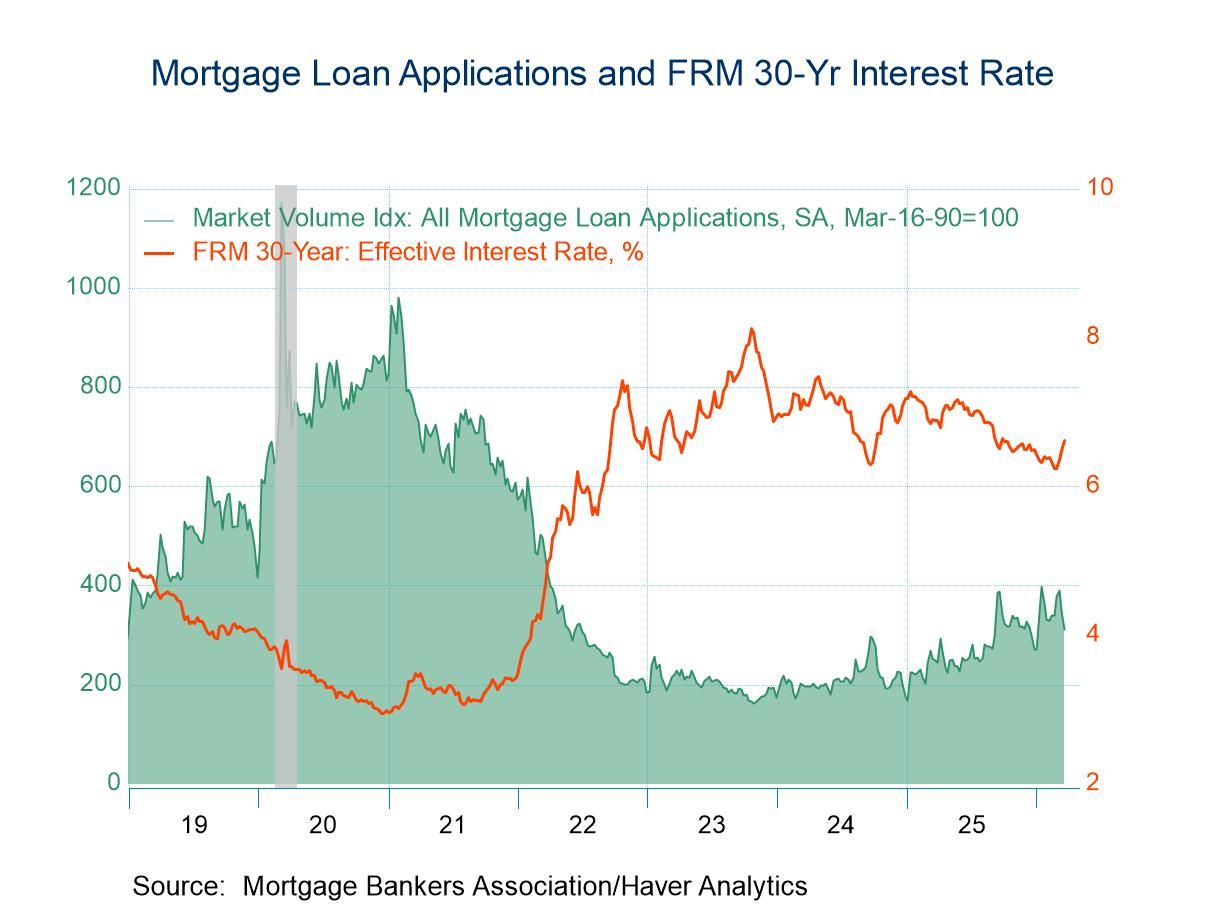
U.S. Mortgage Applications Dropped in the March 20 Week
- Both applications for loans to purchase and for loan refinancing dropped in the latest week.
- Double-digit basis-point rises in all interest rates.
- Average loan size declined.
 Germany| Mar 25 2026
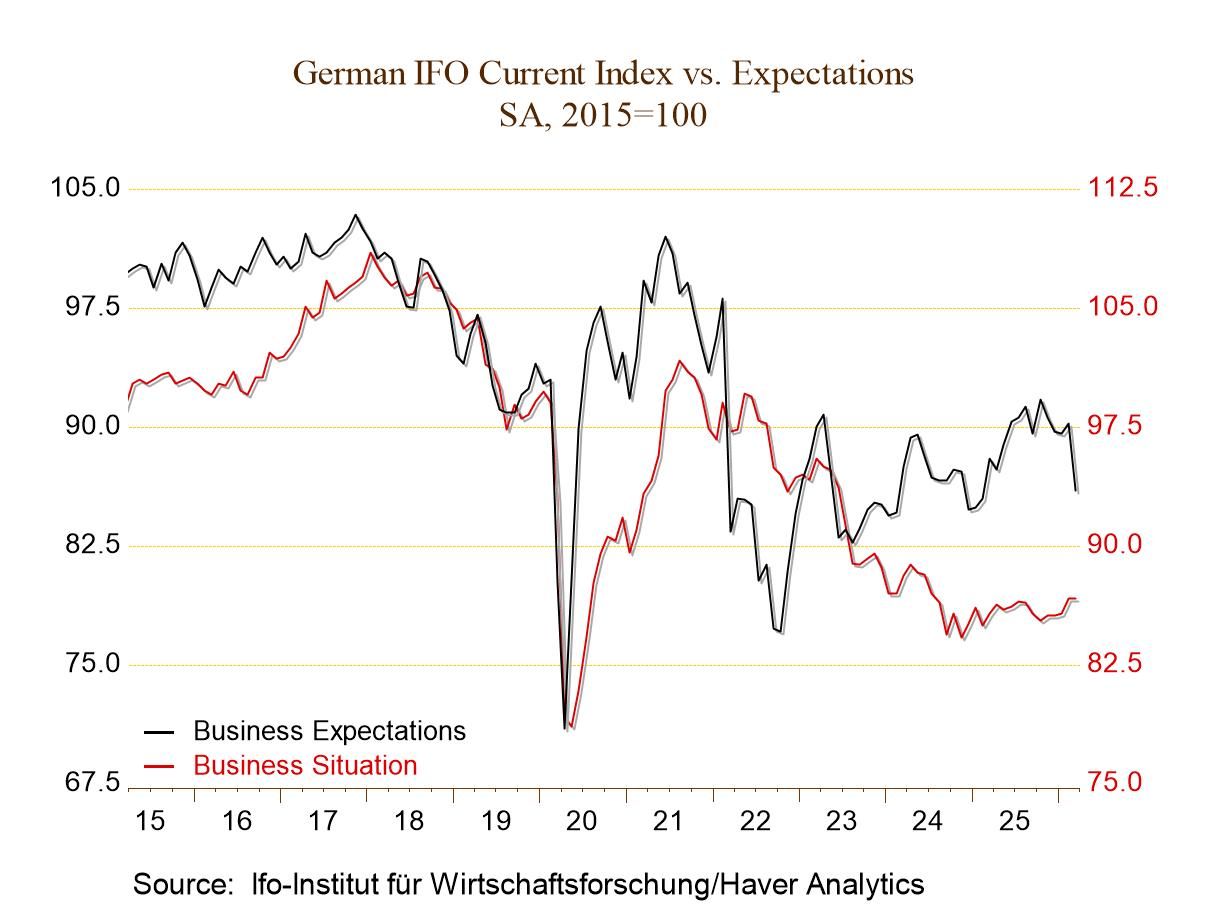
German IFO Sinks Even as the Current Reading Improves
The IFO readings for March 2026 show that the all-sector climate fell to -17.9 from -14.9 in February. The current conditions index improved by the smallest amount possible, rising to -2.4 after reaching -2.5 in February. Expectations, however, were clobbered, with the index in March falling to -19.7 after posting a -10.8 reading in February.
This expectations module for businesses in March registers a month-to-month drop of nearly 9 points; it ranks 246th out of 252 monthly changes, marking it as an occurrence that is this bad or worse, only 2.4% of the time (only 7 worse readings in the last 21 years). It's a stunning one-month backtrack in expectations for Germany.
Early reactions and developments We are currently in late March, so the reading reflects some reaction to the Iran war, and the reaction that we see certainly suggests that there is a relatively severe reaction by the business community to this war. Of course, the initial phase went extremely well from the standpoint of the United States and Israel, not from the standpoint of Iran. As the war has gone on, the U.S. and Israel have continued to register extremely successful military operations with very few of their own losses. However, it has also become clear that Iran intends to fight back on the ground and has tried to spread the conflict regionally using its missile capabilities—which appear to be more far-reaching than previously thought. We are left with the impression that Iran is prepared to engage in guerrilla warfare, which would be very difficult for conventional military operation to completely stamp out. The U.S. has resisted a call for boots on the ground although Donald Trump appears to be sending some paratroopers into the region. The U.S. has threatened to take control of Iran’s crown jewel of oil operations, Kharg Island. This threat has been made to counter Iran’s efforts to try to close the Strait of Hormuz, probably its only trump card. The U.S. has issued additional threats against Iran if it doesn't reopen the strait and allow oil traffic to pass again.
These conditions are, in many ways, a worst-case scenario for Europe and certainly a worst-case scenario for China and Japan that are so incredibly dependent on oil imports. Europe gets its oil imports substantially from the Middle East, meaning that those imports have to flow through the Strait of Hormuz. And then there's the embargoed Russian oil. There has been Iranian oil that has been on the market, having slipped through embargoes using clandestine tankers. U.S. actions in Venezuela have shut down the Venezuelan shipments that were substantially to China. All of these moves create a great impact, an impasse from oil scarcity, which has led to rising oil prices even though the U.S. has uncorked its strategic petroleum reserve and has promised to make more supplies available from that source. Unlike during 1973-75, the U.S. sits in the catbird seat.
The oil weapon has been broken out, and at the same time, turnabout has become fair play as the U.S. now has the upper hand on oil as Iran crimped the supply through the Strait of Hormuz. Strangely, much of Europe had said it would opt out of the U.S. plan to reopen the strait, but after a short period of time, 22 countries have now signed on to help unplug this strait.
Beyond oil (...sort of) The IFO survey shows expectations have dropped exceedingly hard in response to these events, with the expectation standings by industry ranging from a high of 16.1% in manufacturing to a low of 3.1% in retailing and 5.8% for services in general. The net diffusion readings for March range from a negative reading of -39.3 in retailing to a negative reading of -13.8 in manufacturing.
The current conditions rankings range from a high percentile standing in its 70.6 percentile for construction to a low standing in its 16.9 percentile for services.
And this is a report that has not given survey respondents a lot of time to see and react to events.
- of2706Go to 1 page