 Global| May 16 2011
Statistical Evidence Of The Impact Of Japan's March Disasters
Summary
More statistical evidence of the impact of the March earthquake, tsunami and subsequent nuclear meltdown in Japan is beginning to be released. Some indication of the effect on production has already come to the fore. Industrial [...]
 More statistical evidence of the impact of the March earthquake, tsunami and subsequent nuclear meltdown in Japan is
beginning to be released. Some indication of the effect on production has already come to the fore. Industrial
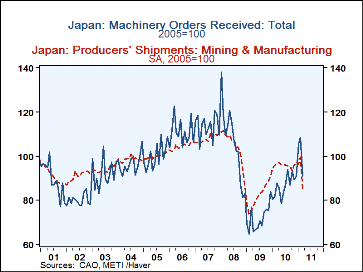
production was down 15.3% in the month of March Today we learn that machinery orders fell 15.8% in March and that shipments
in mining and manufacturing fell 14.3% in March. Indexes (2005=100) for machinery and shipments for mining and manufacturing are
shown in the first chart. (We have converted the order data, which is in billions of yen, to an index (2005=100).
The March declines are among the steepest on record.
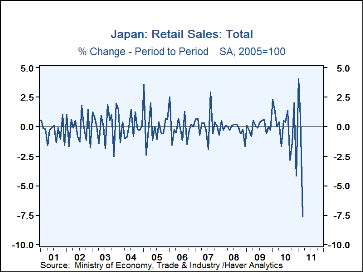
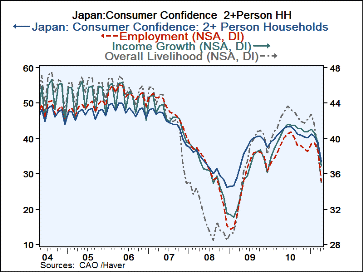
Retail sales declined 7.6% in March and though this appears to be low in comparison with1 the declines in machinery orders and mining and manufacturing shipments, it the largest one month decline in retail sales on record, as can be seen in the second chart. The continued decline in the diffusion index of Consumer confidence suggests that a further decline in retail sales is likely. April data show than consumer confidence of the 2+ person household continues to erode. The overall index declined by 12.8% in April after declining 5.7% in March. The total index as well as the income, employment and overall livelihood components are shown in the third chart.
| JAPAN | Mar 11 | Feb 11 | Mar 10 | M/M | Y/Y | 2010 | 2009 | 2008 |
|---|---|---|---|---|---|---|---|---|
| Machinery: Orders (2005=100) | 91.0 | 108.1 | 82.0 | -15.84 | 3.56 | 86.6 | 71.5 | 106.4 |
| Mining & Manufacturing (2005=100) | 85.3 | 99.5 | 96.9 | -14.27 | -11.79 | 95.8 | 82.1 | 104.4 |
| Retail Sales (2005=100) | 93.3 | 101.0 | 101.8 | -7.62 | -8.35 | 100.5 | 98.2 | 100.2 |
| Apr 11 | Mar 11 | Apr 10 | M/M | Y/Y | 2010 | 2009 | 2008 | |
| Consumer Confidence (Diffusion Index) | 33.4 | 38.3 | 42.0 | -12.79 | -20.44 | 41.4 | 35.4 | 32.4 |
| Income Prospects (Diffusion Index) | 36.9 | 39.5 | 40.4 | -6.58 | -8.66 | 40.5 | 35.4 | 36.2 |
| Employment Prospects (Diffusion Index) | 28.1 | 36.4 | 38.3 | -22.8 | -26.63 | 37.8 | 28.2 | 30.5 |
| Overall Prospects (Diffusion Index) | 34.9 | 38.3 | 42.4 | -8.88 | -17.69 | 42.1 | 36.4 | 31.2 |


