- Deficit: $82.4 bil. in April, down $2.9 bil. (-3.4%) from March’s $85.3 bil.
- Exports +4.0%, fourth straight m/m gain to a record level, driven by a 7.8% rebound in nonauto consumer goods exports.
- Imports +1.9%, third consecutive m/m rise to highest level since Mar. ’25, led by a 7.5% recovery in imports of other goods.
USA| May 29 2026
U.S. Goods Trade Deficit Narrows in April After March Widening


 Global

More Commentaries
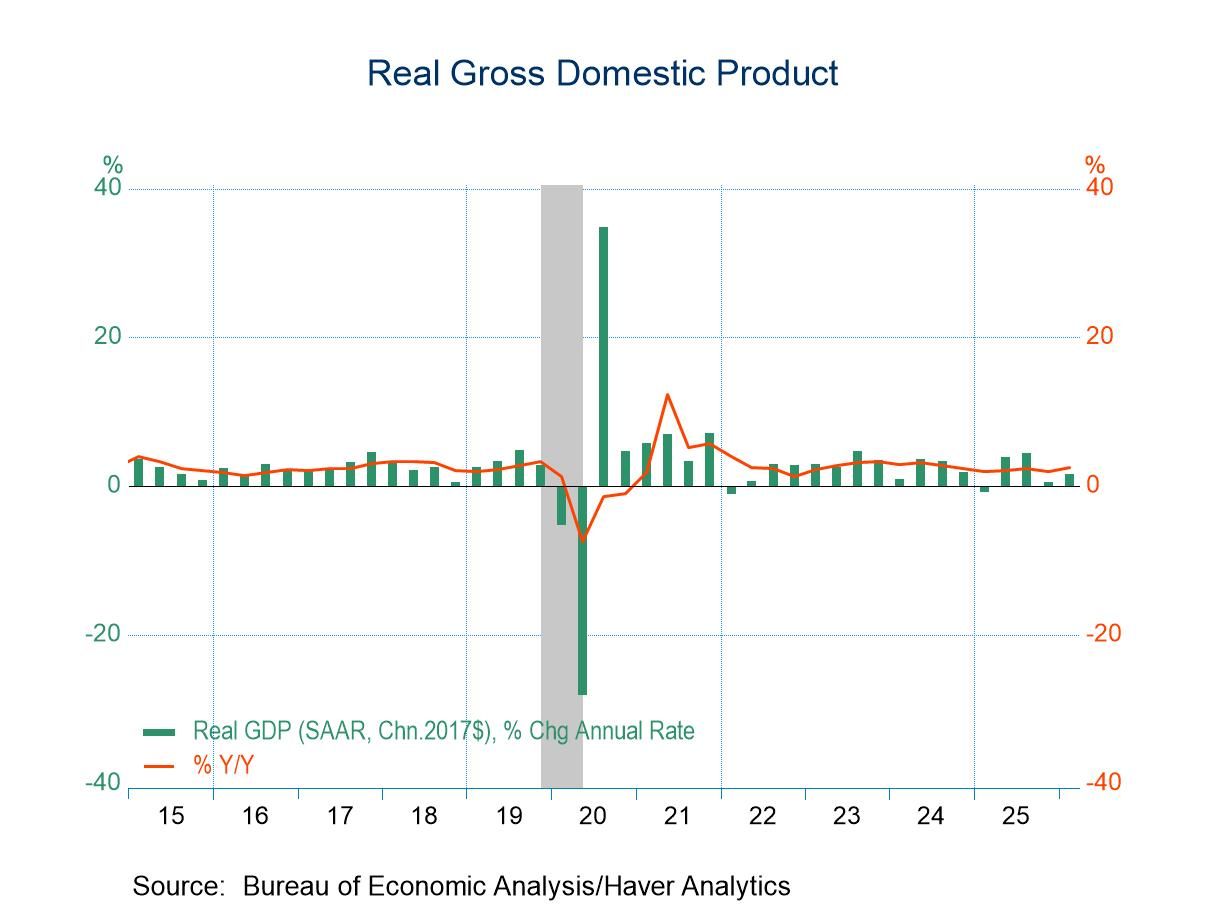
- Q1 GDP growth was unexpectedly revised down to 1.6% saar from 2.0% in the advance estimate.
- There was little revision to the major expenditure components with almost all of the total downward revision due to a larger decline in inventories than previously estimated.
- Domestic demand growth was revised down a tick but was still a solid, above-trend 2.4%.
- This report provided the first look at Q1 corporate profits. Profit growth slowed to 0.9% q/q not annualized but this was on top of a 10.7% jump in the previous two quarters.
by:Sandy Batten
|in:Economy in Brief
 USA| May 28 2026
U.S. Initial Unemployment Claims Rose in the Week of May 23
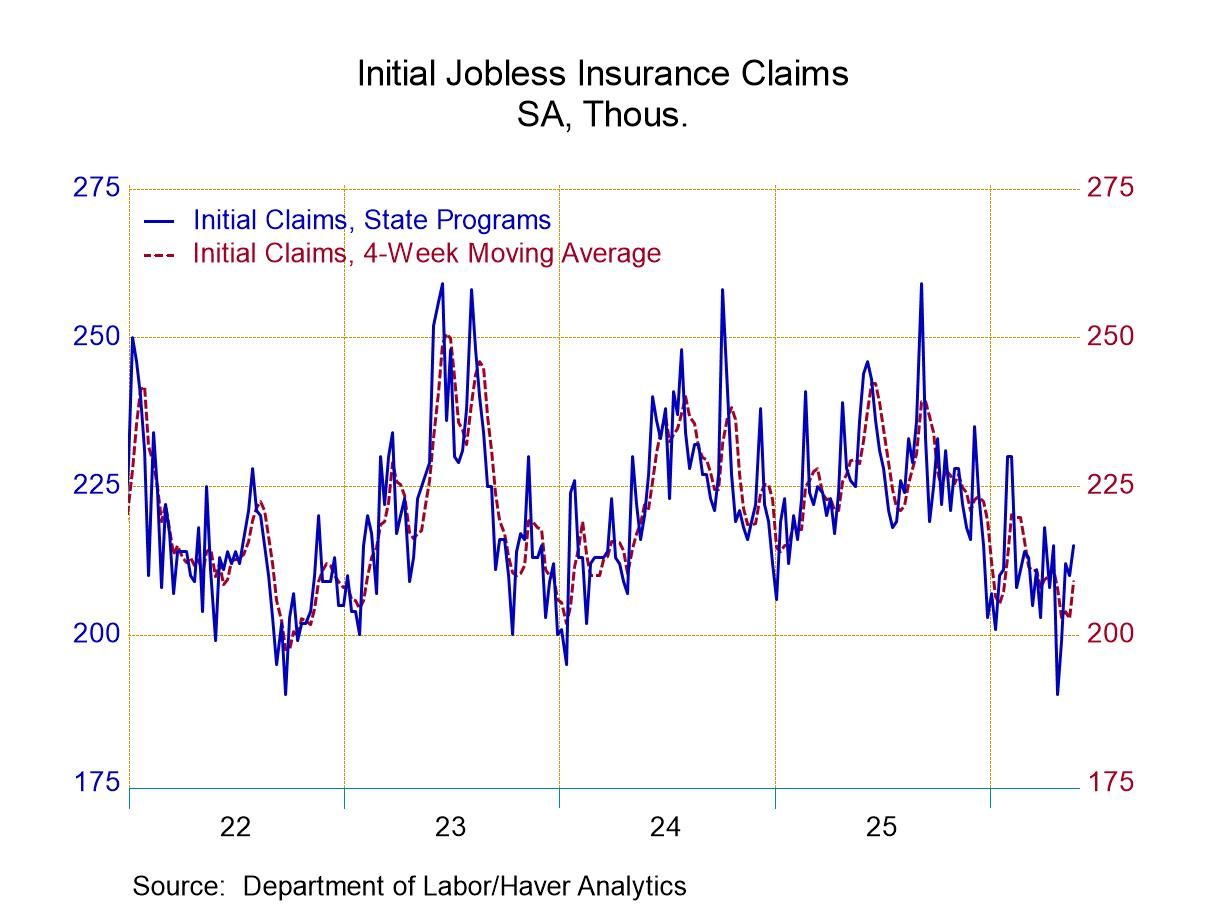
- New claims rose by 5,000 to 215,000 in the week ending May 23.
- Continuing claims rose by 15,000 to 1.786 million, but the downward trend in place since October 2025 remains in place.
- The insured unemployment rate was unchanged at 1.2% in the week of May 16.
 United Kingdom| May 28 2026
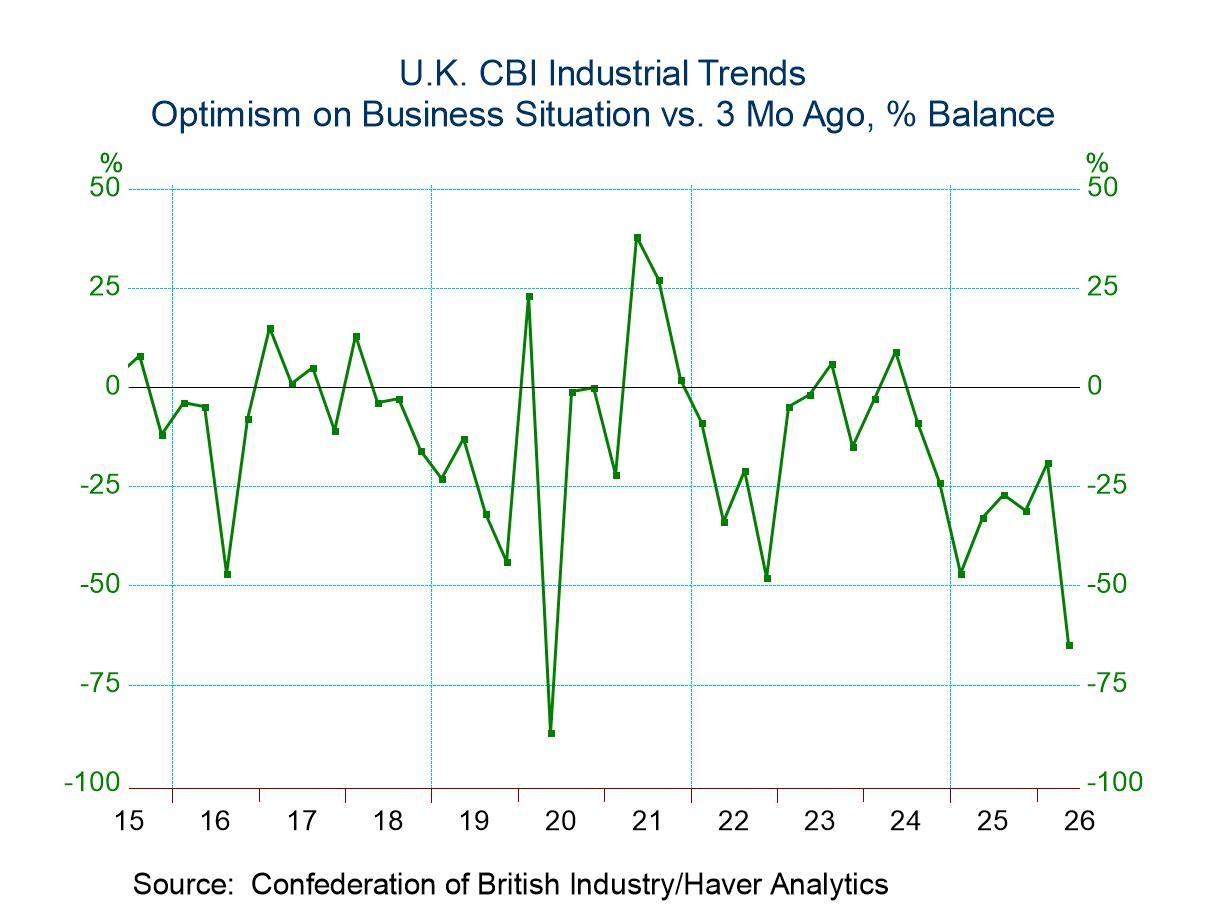
U.K. CBI Industrial Quarterly Survey Weakens
The Confederation of British Industry (CBI) shows business optimism falling sharply in Q2 2026, joined by a drop in export optimism. Expectations for capital goods spending excluding buildings improved slightly on the quarter, with the index reading rising to -38 from -44. Expectations for capital spending excluding equipment fell significantly to -36 in the second quarter from -22 in the first quarter. The two capital spending measures each have rankings below the 20th percentile; for capital spending excluding buildings, the figure is extremely weak.
The number employed over the last three months shows a slight decline to -19 from -16; however looking ahead to the next three months, the decline repeats, falling to -26 from -18 in the first quarter. The rankings for these two metrics are both in the low 30th percentiles.
New order volume for three months ago and three months ahead remain weak, with the three-month ago reading stuck at -21 and the three-month-ahead reading falling from -12 in the first quarter to -31 in the second quarter. The rankings for these two metrics are each at the 15th percentile or lower.
The volume of domestic orders for three months ago edged slightly lower, to -25 from -23; however for three months ahead it weakens more sharply to -32 from -17. Both of these metrics have rankings at the 15th percentile or weaker.
The volume for foreign orders from three months ago improved to -4 from -12. The volume for three months ahead has weakened only slightly, from +1 in the first quarter to -2 in the second quarter. The three-month-ago reading has a 35th percentile ranking, while the three-month-ahead ranking is at its 47th percentile. The foreign sector appears to be carrying some stimulus to the U.K. economy.
The volume of output from three months ago was slightly weaker in the second quarter, while the volume of output for three months ahead is expected to weaken from a -14 reading in Q1 to -20 in Q2. Both metrics have a lower 10th percentile standing.
The average cost of output three months ago rose sharply to an index reading of in the second quarter 54 from 33 in the first quarter. Looking ahead to the next three months, another ratchet up is in progress, to a reading of 79 from 50 in the first quarter. These are suddenly extremely strong readings, with three-months-ago reading at a 78th percentile standing and the three-month-ahead reading at essentially a 90th percentile standing.
The average price for domestic orders three months ago has gone up from an index value of 2 in the first quarter to 17 in the second quarter, while the average price for domestic orders for three months ahead edged up to a reading of +32 from +29 in the first quarter. The three-month-ago reading has a 53rd percentile standing, while the three-month-ahead reading has an 89th percentile standing. Price expectations are hot.
The average price on foreign orders for three months ago rose from -4 in the first quarter to +15 in the second quarter, logging a 49th percentile standing, pretty close to its historic median. The average price for foreign output for three months ahead moved down to +19 from +23 in the first quarter and has a very strong 91.8 percentile standing. The Q/Q pressure eased a bit but remains intense.
 USA| May 27 2026
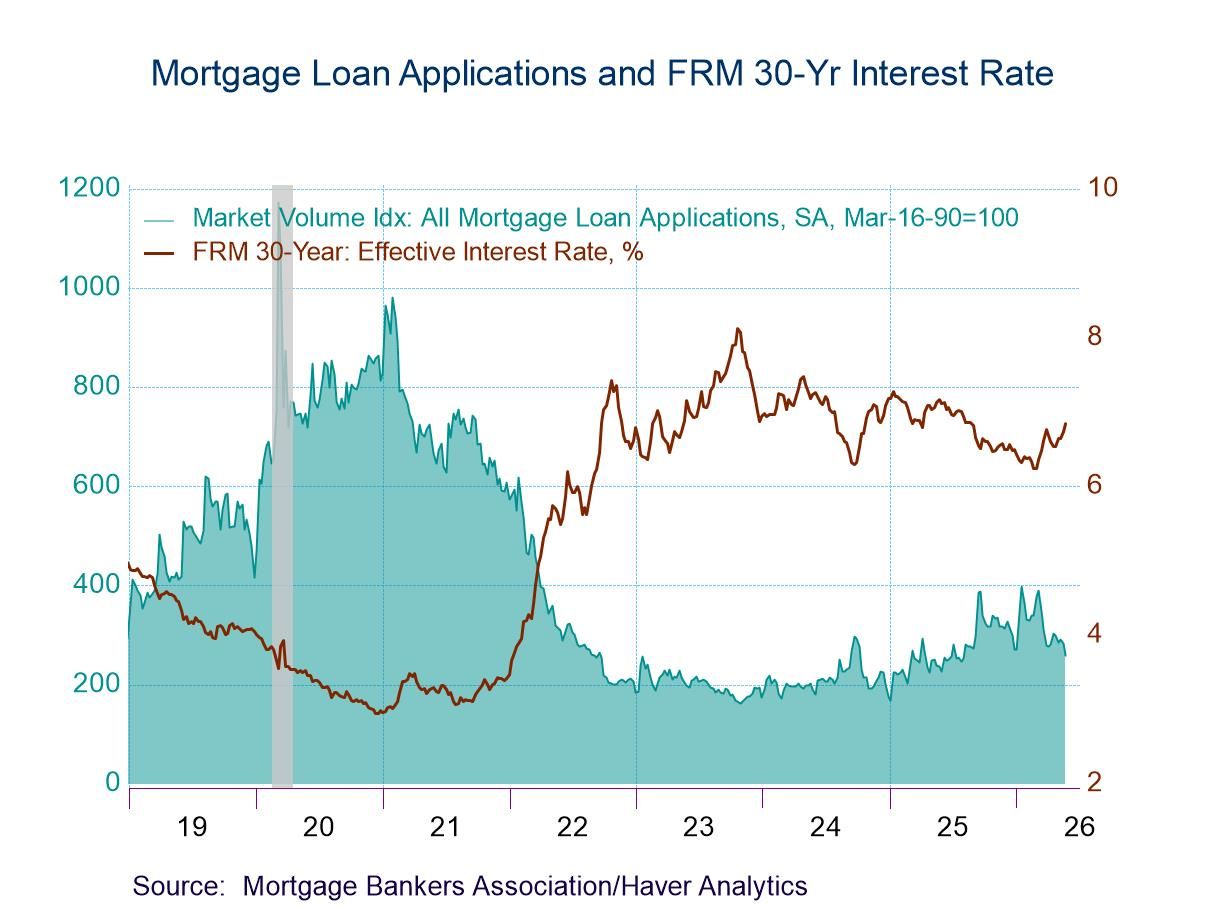
U.S. Mortgage Applications dropped in the May 22 Week
- Both applications for loans to purchase and applications for loan refinancing declined in the latest week.
- Interest rate on 30-year fixed-rate loans rose 11bps to 6.73%, after rising 9bps in the prior week.
- Average loan size rose.
 France| May 27 2026
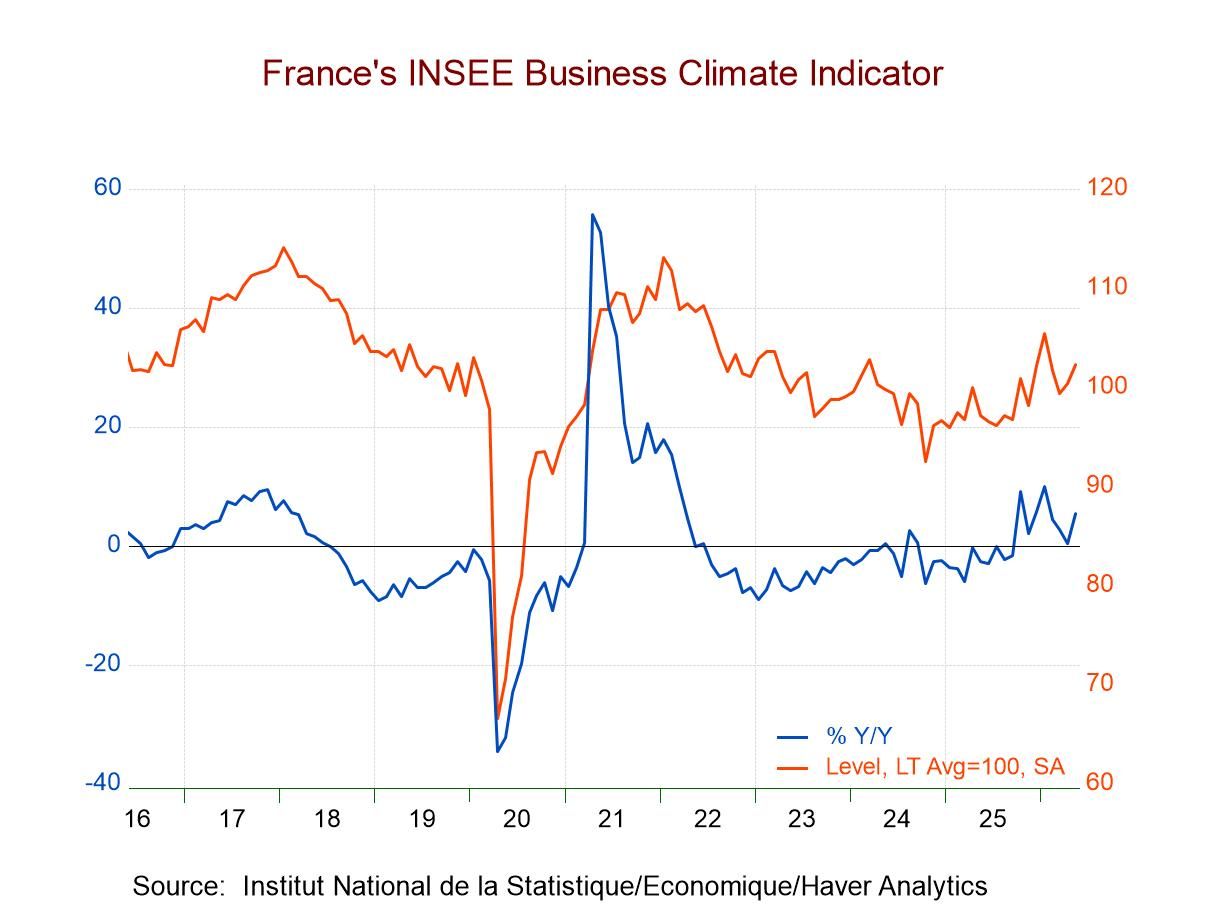
INSEE: French Manufacturing Rebounds Amid Weakness
The French manufacturing climate index improved in May, rising to 102.3 after climbing to 100.4 in April from 99.4 in March.
Despite the improvement, the standing of the climate index is only at its 50.4 percentile, leaving it just slightly above its historic median on data back to 2001. Industry climate now is still slightly lower than it was in January 2020, just before COVID hit.
The survey components tell a mixed story about prospects for industry in France. Manufacturing production expectations improved slightly in May, moving to -17.0 from -17.4 in April; however, both readings were sharply weaker than the value in March. The standing of production expectations in May is at its 25.4 percentile, marking it as just a hair above its lower quartile when ranked on data back to 2001. This is a weak and uninspiring showing.
The recent trend of production is much more upbeat, rising to 14.3 in May from 3.6 in April. It also shows a sharp improvement compared to a year ago, when the value was 3.7. Its standing is significantly above its historic mean, and the ranking for this May observation is at its 82nd percentile—a solid showing. It is the strongest response in the survey among demand and activity variables. But can that trend hold?
The personal likely trend, in which survey respondents respond to prospects for their own firms and industries, shows much less ebullience, with the May reading of 4.4 and a steadily diminishing trend from March to April to May. The personal likely trend is still stronger than a year ago, when it was -3.1, although it is significantly below its historic mean, with a ranking at its 28th percentile. It is a reading that is nearly completely decoupled from the recent trend responses in this same survey.
Orders and demand in May improved to -14.1 from -15 in April; in April, the index had improved from -18.2 in March. There is a similar trend and improvement for foreign orders and demand as well. Both overall and foreign demand are improved compared to a year ago; both are stronger than their historic means, and each of the series has a ranking in its 61st percentile—above their respective historic medians with some margin, enough to say the responses look firm. Yet, there is not enough to say they look strong. Both readings are still below their levels in January 2020, before COVID struck.
The INSEE survey also includes two observations on prices: the own-likely price trend and the manufacturing price trend. Both have been moving up sharply from March to April to May; both are significantly above their year-ago levels and relatively strong compared to their historic means. Both series also have high percentile rankings, with the own-likely price trend at a 90.2 percentile ranking and the manufacturing price level at an 88.5 percentile ranking. Both are also substantially above their levels of January in 2020, before COVID struck.
 USA| May 26 2026
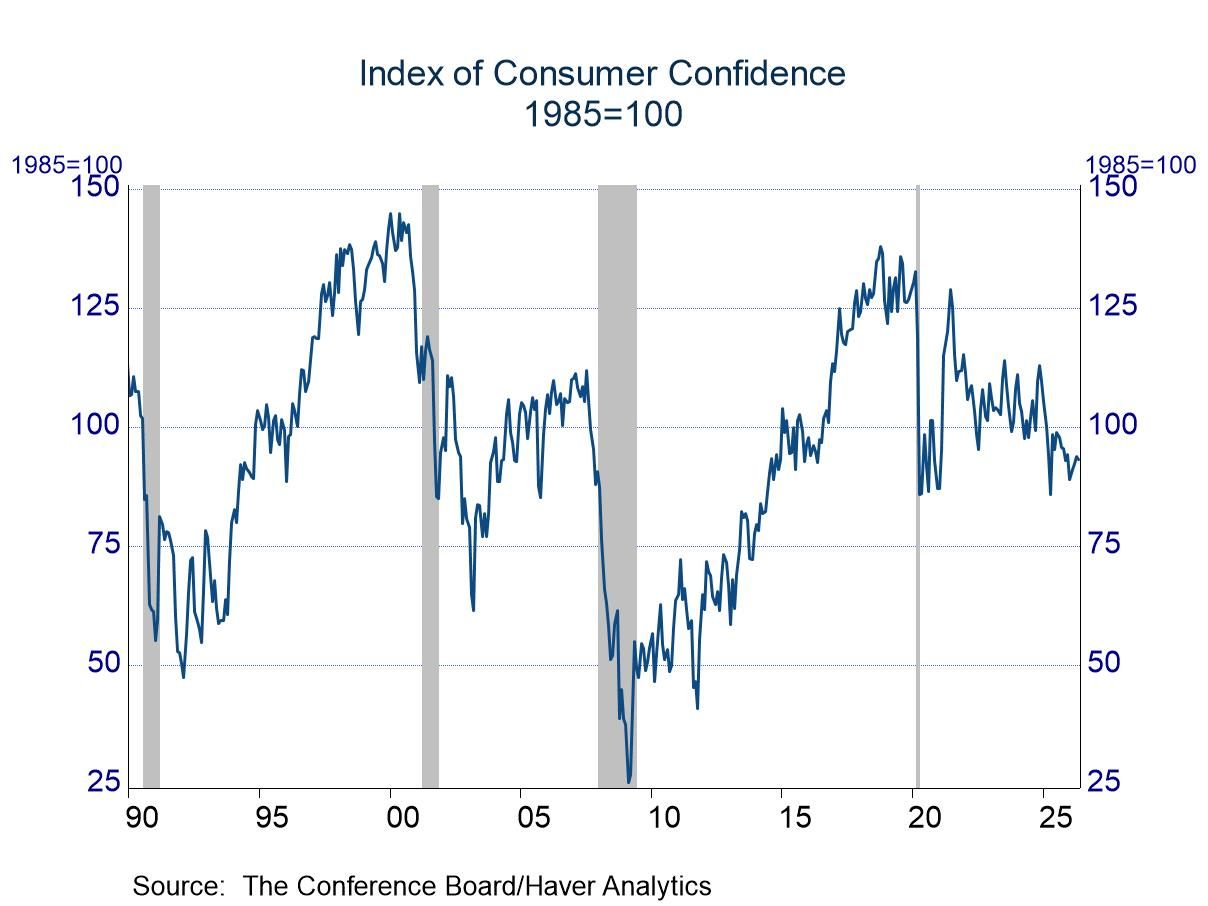
Consumer Confidence: Slightly Lower in May
- Assessments of the present situation slipped, but views were still above long-run norms.
- Expectations improved slightly in April, but they are still below the long-run average.
 USA| May 26 2026
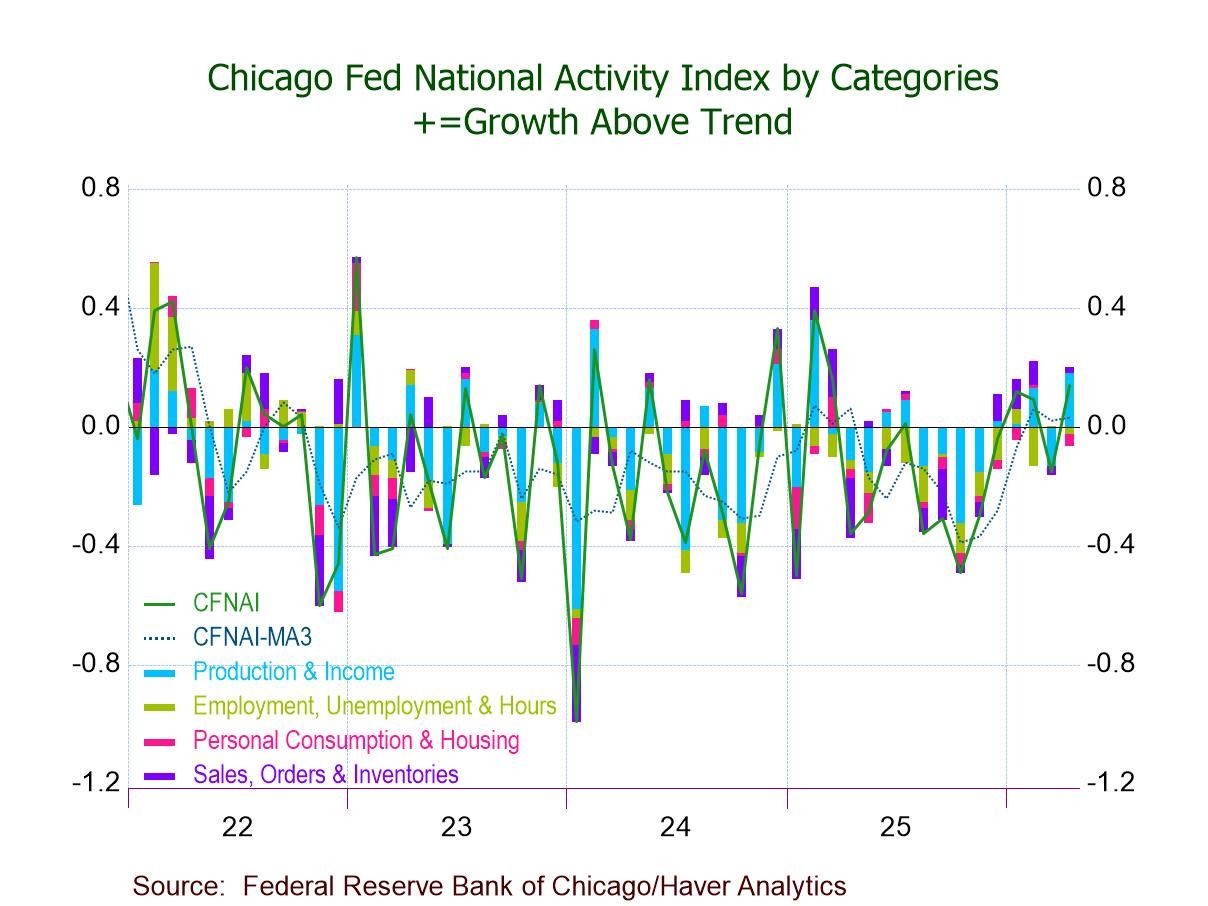
Chicago Fed National Activity Index Turns Positive in April
- CFNAI +0.14 in April, highest since March ’25; -0.15 in March.
- Two of four CFNAI components up m/m; two make positive contributions.
- CFNAI-MA3 edges up to +0.03, third straight positive reading; above -0.70 (recession signal).
- CFNAI Diffusion Index rises to +0.06, highest since Oct. ’22.
 United Kingdom| May 26 2026
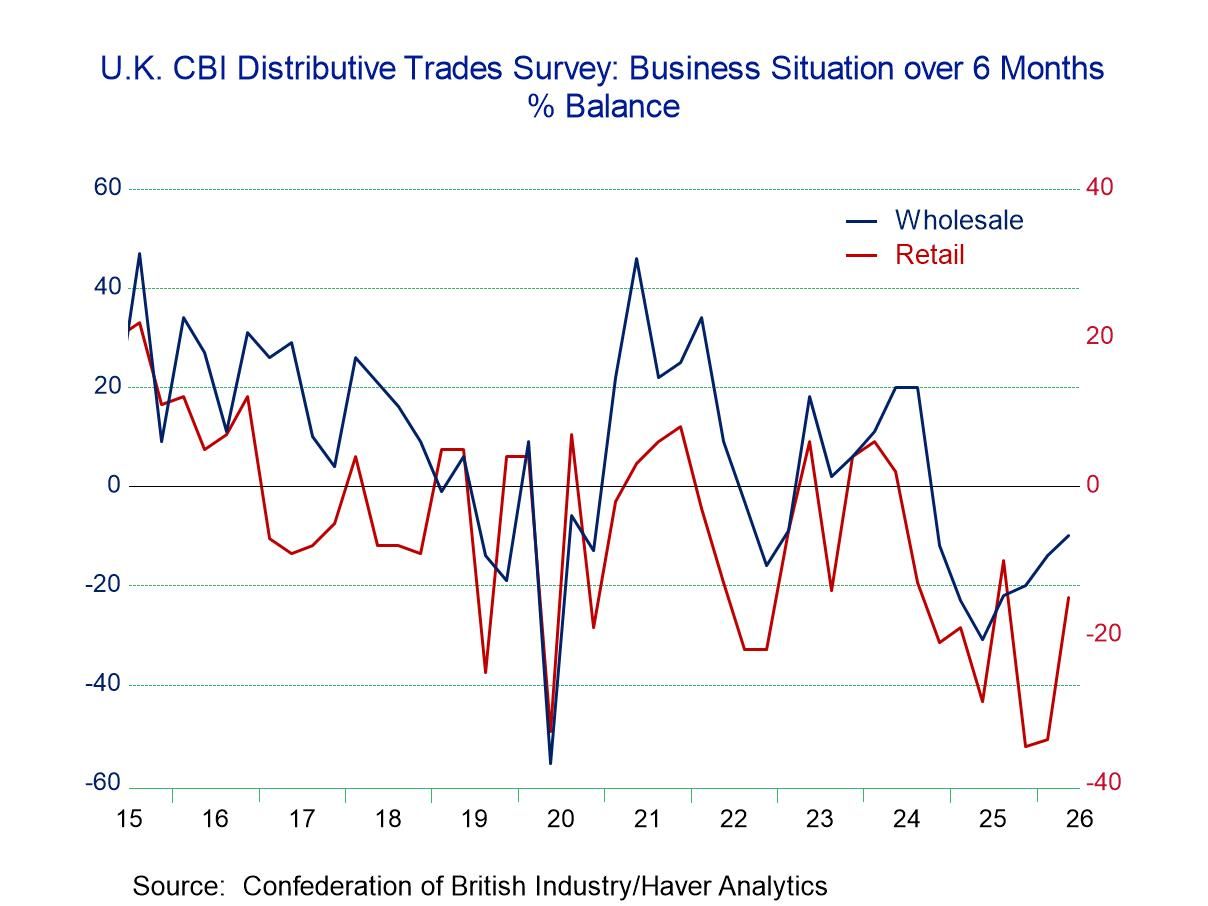
U.K. Distributive Trades Survey Is Broadly Weak
The U.K. distributive trades survey in retaliating for the second quarter of 2026 shows some improvement in the business situation expected over the next six months as that reading rose to -15 from -34 in the first quarter, putting it only slightly weaker than its third-quarter 2025 reading of -10. Still, it is a very weak reading.
The employment reading also improved in the second quarter to -30 from -40 in the first quarter. That reading, however, is still lower than its -19 reading in the fourth quarter and its -14 reading on the third quarters of 2025.
Capital spending plans on the quarter for the year ahead registered -52 in the second quarter, compared to -46 in the first quarter; this reading has steadily deteriorated.
Imports have improved slightly in the second quarter, with the reading at 7 compared to 10 in the first quarter and 13 in the fourth quarter.
The expected selling price compared to what it registered a year ago is at 42, compared to 40 in the first quarter; they compared to even stronger values at the end of last year. Expected employment in the second quarter fell sharply to -44 from -23 in the first quarter, and this reading has steadily and strongly deteriorated, particularly in the second quarter itself.
Comparing the trailing 4-quarter to 8-quarter averages shows clear deterioration across the board, except for prices. That clarifies the overall story and trend for retailing.
The retail rankings are uniformly weak, with the exception that the selling price has a 43.6 percentile standing, which is still below its historic median ranking. However, the standings for imports, capital spending, and employment are all below the 10th percentile, with the business situation coming in an 11.4 percentile standing. The expected selling price has a 63.6 percentile standing, well above its historic median (the median occurs at a ranking of 50%). Meanwhile, employment, looking ahead, has only a 2.9 percentile standing, clearly not much of a vote of confidence in the outlook for the economy.
The wholesaling portion of the distributive trades report also registers weak standings, but they are higher than those seen in retailing, with the business situation at an 18.6 percentile standing, imports at a 25.7 percentile standing, and employment at a 17.1 percentile standing, while capital spending plans are at a very weak 5.7 percentile standing. All these metrics are generally stronger than for retailing; they're still poor readings and generally below their respective medians. The only exception is the selling price with a 77.9 percentile standing, which is only a vote of confidence for inflation. The expected selling price compared to a year ago has a 44.3 percentile standing, while employment expectations compared to a year ago are at a 35-percentile standing.
Similarly, in wholesaling as for retailing, the comparison of 4-quarter to 8-quarter averages shows across the board deterioration, except for prices. The distributive trades sector for retailing as well as for wholesaling is fading.
Summing up The United Kingdom distributive trades survey is telling us clearly that it is a weak environment for the distributive trades. The standings of the current readings are weak, and the outlook and forward-looking portions of the survey are weak as well. The economy continues to fight inflation that has been over the top for some time, and inflation is still above target, keeping the BOE inflation-vigilant. Global conditions are mixed with the cutoff of goods shipments through the Straits of Hormuz impacting economies globally. The second quarter survey is a depressing statement on the state of the outlook for the U.K. economy.
- of2719Go to 1 page