 Global| Feb 03 2020
Greatest Economic Performance Ever? I Report, You Decide
|in:Viewpoints
Summary
The charts below show the behavior of some important measures of economic performance. Generally, the time period shown in the charts starts in the early 1950s and runs through the end of 2019. In some cases, the data are not [...]
The charts below show the behavior of some important measures of economic performance. Generally, the time period shown in the charts starts in the early 1950s and runs through the end of 2019. In some cases, the data are not available for the early 1950s. In these cases, the chart time period begins with the first available data. In all of the charts, the behavior of the economic performance variable in question is measured over the period in which Donald J. Trump has occupied the presidency of the United States. In the case of monthly data, the Trump presidency commences in February 2017. In the case of quarterly data, the Trump presidency commences in Quarter 1, 2017. In all of the charts, there are two vertical lines indicating the beginning and the end of the Obama presidential incumbency. With that, let's begin the chart show.
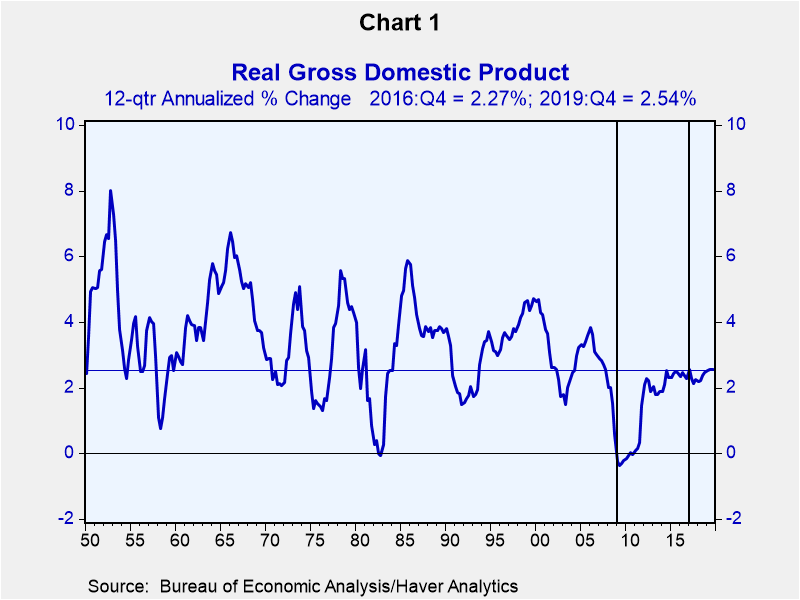
In the 12 quarters of the Trump presidency, U.S. real GDP grew at an annualized rate of 2.54%. This is higher than the 2.27% annualized growth in the final 12 quarters of the Obama presidency and is marginally higher than any 12-quarter period of the Obama presidency. But from 1950 through 2008, there are numerous 12-quarter time spans in which annualized real GDP growth far exceeded 2.54%.
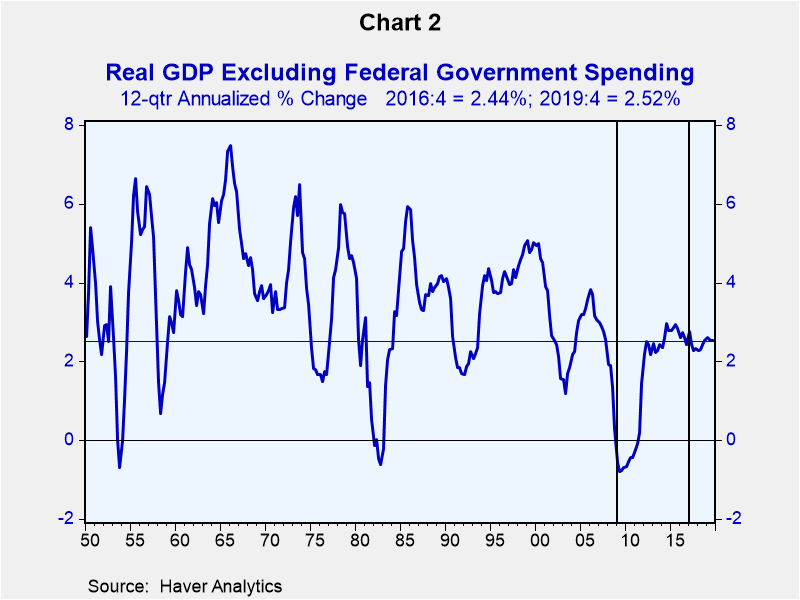
In the 12 quarters of the Trump presidency, real GDP excluding federal government consumption and investment expenditures grew at an annualized rate of 2.52% vs. 2.44% in the final 12 quarters of the Obama presidency. However, there were several 12-quarter intervals during the Obama presidency when real GDP excluding the federal government component grew at annualized rates in excess of 2.52%. And again, 2.52% annualized growth pales in comparison to growth of this measure prior to the Obama presidency.
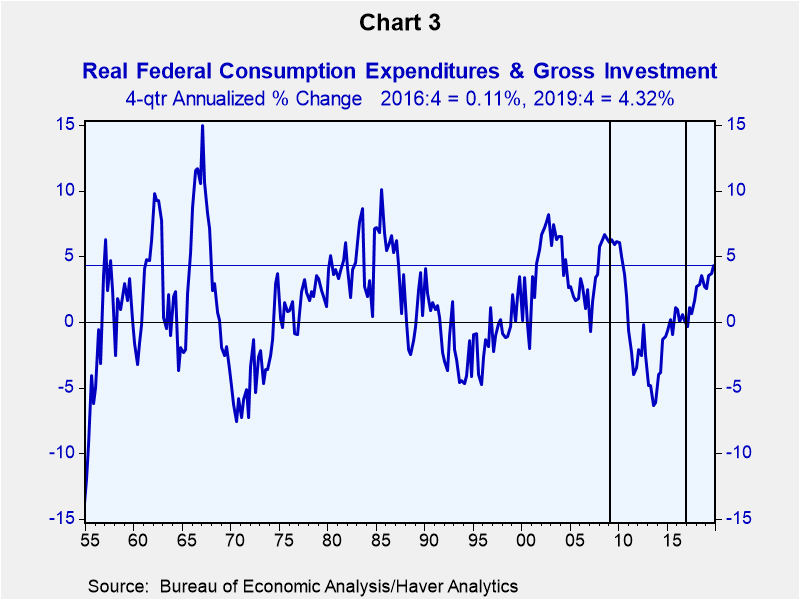
Speaking of real federal government consumption and gross investment expenditures, so far during the Trump presidency, they have grown at an annualized rate of 4.32% compared to 0.11% annualized growth in the final 12 quarters of the Obama presidency. During numerous 12-quarter intervals of the Obama presidency, these real government expenditures contracted. The median 12-quarter annualized growth in real federal government consumption and gross investment expenditures in the 1955 through 2019 period was 1.59%.
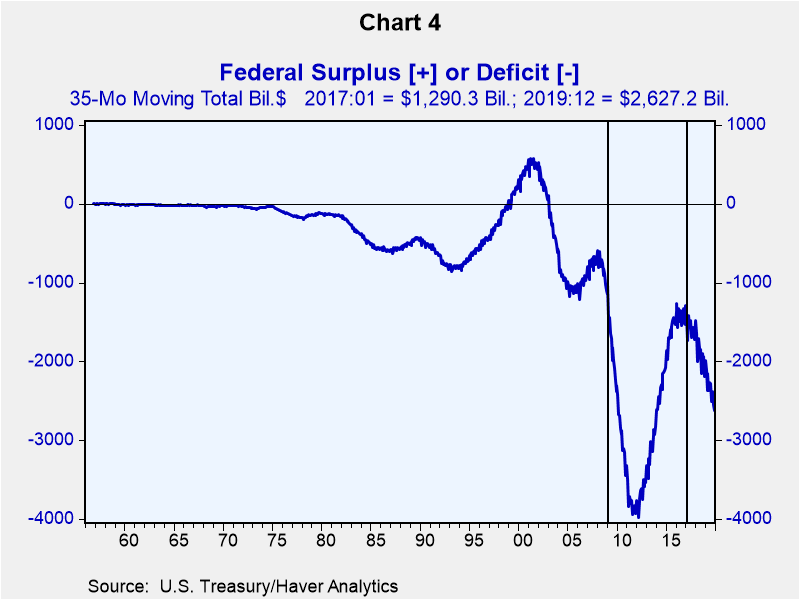
While on the subject of federal government spending, in the 35 months of the Trump presidency, nominal federal government expenditures of all kinds – consumption, investment, Social Security, Medicare, etc. – exceeded federal government revenues, including tariffs paid by U.S. importing companies, by a cumulative $2.627 trillion. In the final 35 months of the Obama presidency, the cumulative federal government deficit totaled $1.290 trillion. The cumulative deficit of $2.627 trillion is the widest 35-month cumulative deficit since 1956, excluding the deficits resulting from the Great Recession.
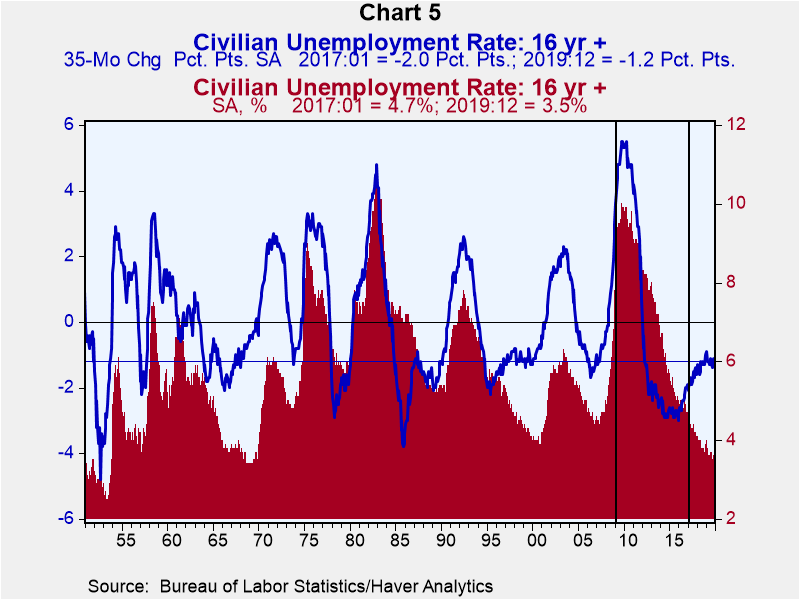
Now, let's turn to unemployment rates. In the 35th month of the Trump presidency, December 2019, the headline unemployment rate was 3.5%, the lowest since the late 1960s. This represented a decline in the unemployment rate in the 35 months ended December 2019 of 1.2 percentage points. In the 35 months ended January 2017, the headline unemployment rate declined 2.0 percentage points. In the 35 months ended December 2015, the headline unemployment rate declined 3.0 percentage points.
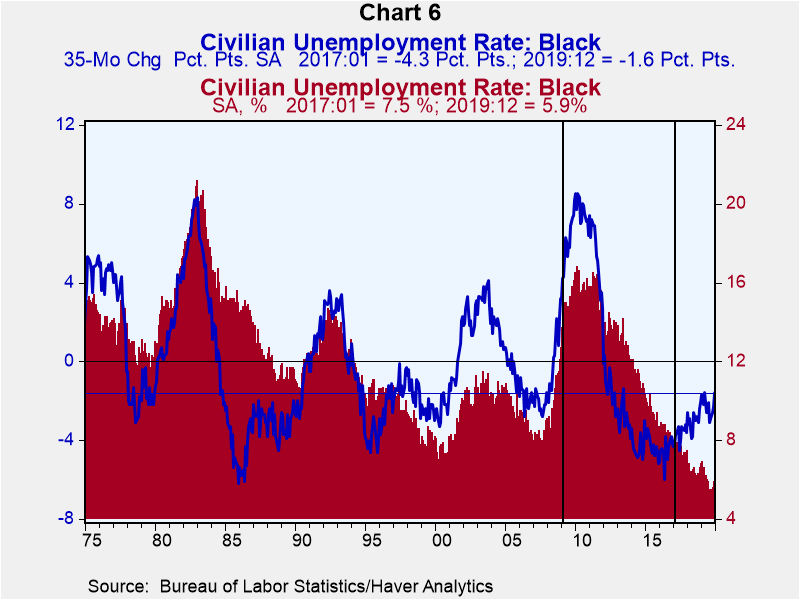
Similarly, at 5.9% in December 2019, the unemployment rate for black U.S. residents stood just off its record low since the data began to be compiled in 1972. But the decline in the black unemployment rate in the 35 months ended December 2019 was 1.6 percentage points vs. 4.3 percentage points in the 35 months ended January 2017 and 6.0 percentage points in the 35 months ended May 2016.
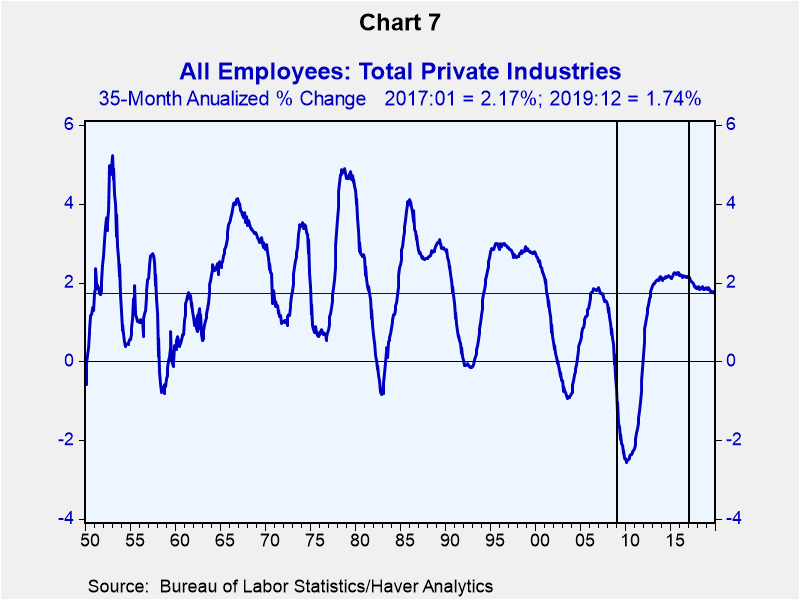
Although the number of private nonfarm payroll jobs was at a record high in December 2019, the compound annualized growth in private nonfarm payroll jobs was only 1.74% in the 35 months ended December 2019. In contrast the annualized growth in private nonfarm payroll jobs in 35 months ended January 2017 was 2.17%. Prior to the Great Recession, there were numerous 35-month intervals in which the annualized growth in private nonfarm payrolls was much higher than 1.74%.
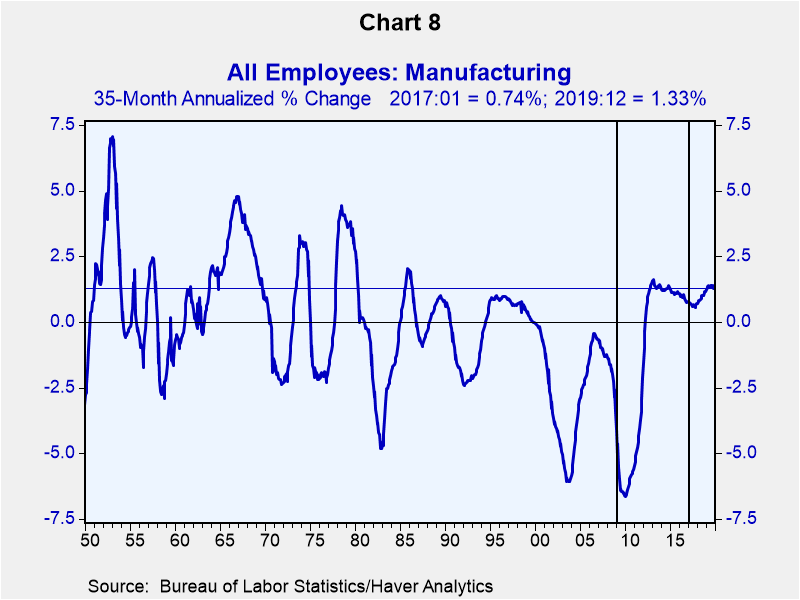
Manufacturing payroll jobs grew at an annualized rate of 1.33% in the 35 months ended December 2019 in contrast to 0.74% in the 35 months ended January 2017. But in the 35 months ended February 2013, manufacturing payrolls grew at an annualized 1.60%, the fastest since the 35 months ended March 1986.
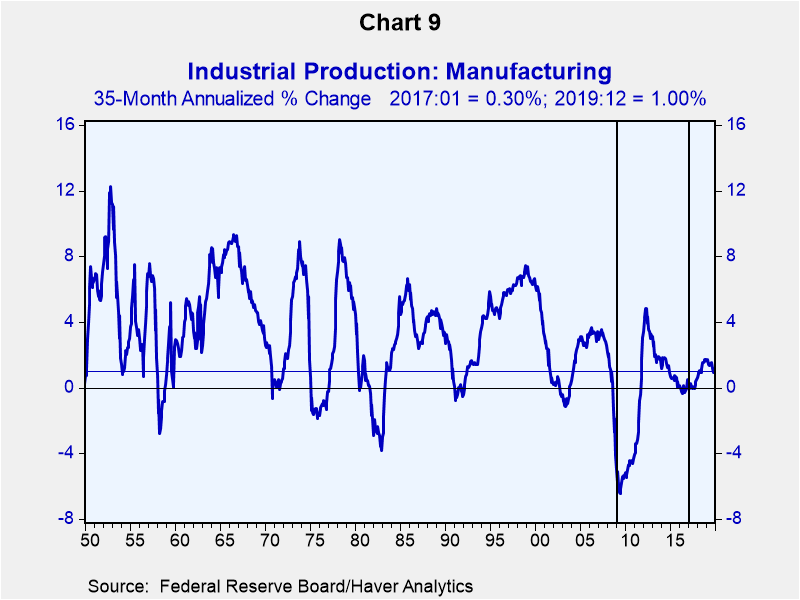
The manufacturing industrial production index grew at an annualized 1.00% in the 35 months ended December 2019. In contrast it grew at only 0.30% in the 35 months ended January 2017. But it grew at an annualized 4.83% in the 35 months ended April 2012.
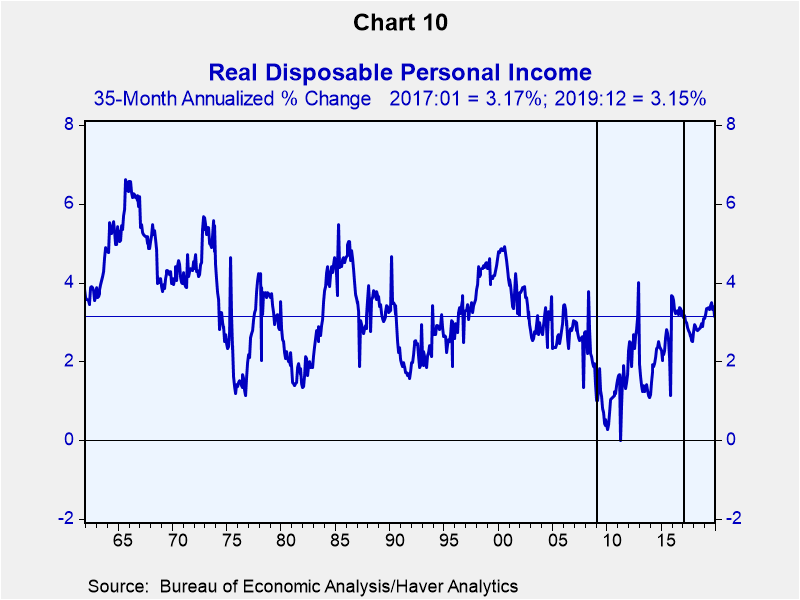
Let's look at how real after-tax personal income has been behaving in light of a low unemployment rate and the tax cut (some people say the largest tax cut in history) signed into law on December 22, 2017. In the 35 months ended December 2019, real after-tax personal income grew at an annualized rate of 3.15%, a rounding error compared to the annualized growth of 3.17% in the 35 months ended January 2017. In the 35 months ended December 2012, real after-tax personal income grew at an annualized 4.00%, perhaps in response to the tax cut signed into law on February 17, 2009.
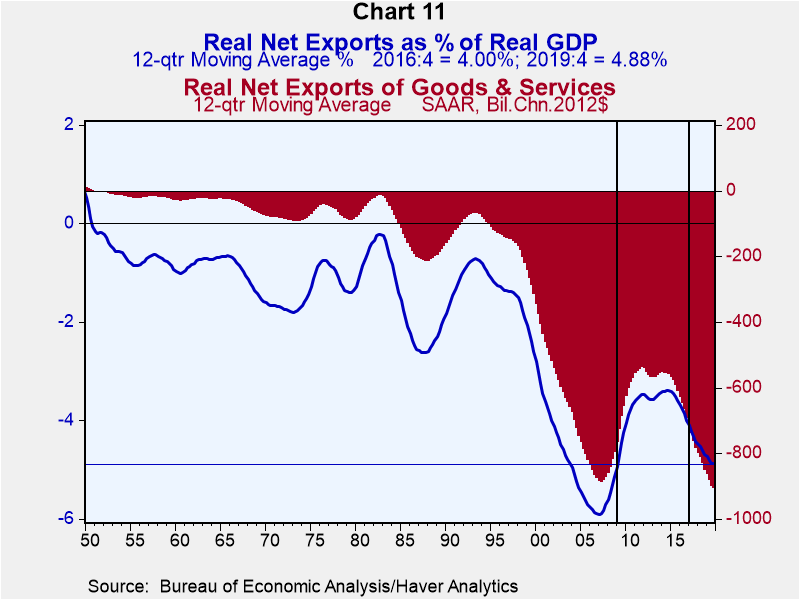
In the 12 quarters ended 2019:4, real net exports (i.e., the real trade balance) averaged minus $908.0 billion, the widest U.S. trade deficit in the post-WWII era. As a percent of real GDP, real net exports averaged minus 4.88% in the 12 quarters ended 2019:4. In the 12 quarters ended 2016:4, real net exports as a percent of real GDP averaged minus 4.00%. In the 12 quarters ended 2014:4, real net exports as a percent of real GDP averaged minus 3.38%.
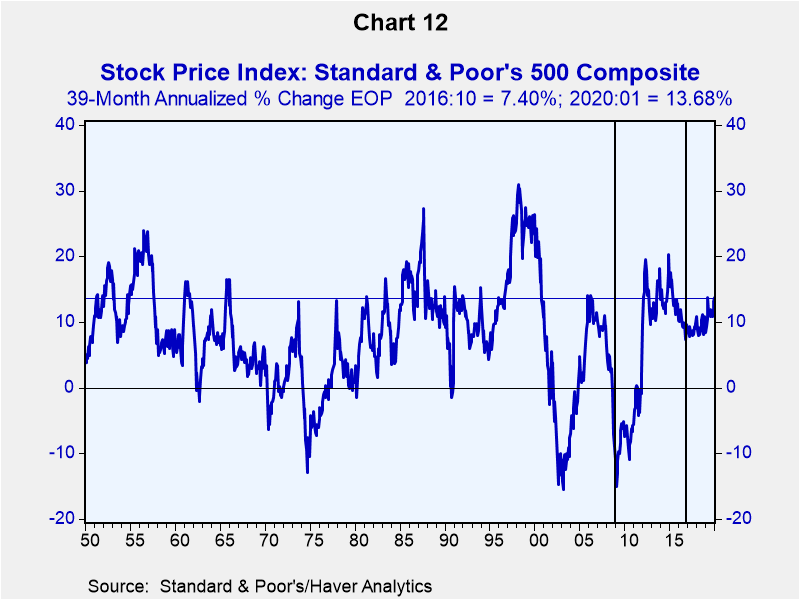
Expectations drive the behavior of financial markets. This is why I use as a starting point November 2016 for examining the behavior of the U.S. stock market in this exercise. In the 39 months ended January 2019, the S&P 500 stock price index increased at an annualized rate of 13.68%. In the 39 months ended October 2016, the S&P 500 index increased at an annualized rate of 7.40%. There were numerous 39-month intervals between November 2008 and October 2016 in which the annualized rate of increase in the S&P 500 exceeded 13.68%. For example, in the 39 months ended December 2014, the S&P 500 index increased at an annualized rate of 20.23%.
So, has the U.S. experienced the greatist economic performance ever in the past 12 quarters (or past 39 months in the case of the stock market? I just reported. You decide.
Viewpoint commentaries are the opinions of the author and do not reflect the views of Haver Analytics.Paul L. Kasriel
AuthorMore in Author Profile »Mr. Kasriel is founder of Econtrarian, LLC, an economic-analysis consulting firm. Paul’s economic commentaries can be read on his blog, The Econtrarian. After 25 years of employment at The Northern Trust Company of Chicago, Paul retired from the chief economist position at the end of April 2012. Prior to joining The Northern Trust Company in August 1986, Paul was on the official staff of the Federal Reserve Bank of Chicago in the economic research department. Paul is a recipient of the annual Lawrence R. Klein award for the most accurate economic forecast over a four-year period among the approximately 50 participants in the Blue Chip Economic Indicators forecast survey. In January 2009, both The Wall Street Journal and Forbes cited Paul as one of the few economists who identified early on the formation of the housing bubble and the economic and financial market havoc that would ensue after the bubble inevitably burst. Under Paul’s leadership, The Northern Trust’s economic website was ranked in the top ten “most interesting” by The Wall Street Journal. Paul is the co-author of a book entitled Seven Indicators That Move Markets (McGraw-Hill, 2002). Paul resides on the beautiful peninsula of Door County, Wisconsin where he sails his salty 1967 Pearson Commander 26, sings in a community choir and struggles to learn how to play the bass guitar (actually the bass ukulele). Paul can be contacted by email at econtrarian@gmail.com or by telephone at 1-920-559-0375.


