 Global| Sep 28 2020
Households Saving for a Rainier Day and Corporations Making Hay while the Sun Shines
|in:Viewpoints
Summary
The Fed released its Q2:2020 Financial Accounts (formerly known as the Flow of Funds) data on September 21. This quarter's data were (if you took high school Latin) more interesting than usual given what households did with the money [...]
The Fed released its Q2:2020 Financial Accounts (formerly known as the Flow of Funds) data on September 21. This quarter's data were (if you took high school Latin) more interesting than usual given what households did with the money dropped from the government (black?) helicopters and what corporations did with reduced bond yields across all risk categories. To preview, households loaded up on bank deposits and corporations loaded up on debt. Both cut back on their purchases of goods and services in the second quarter.
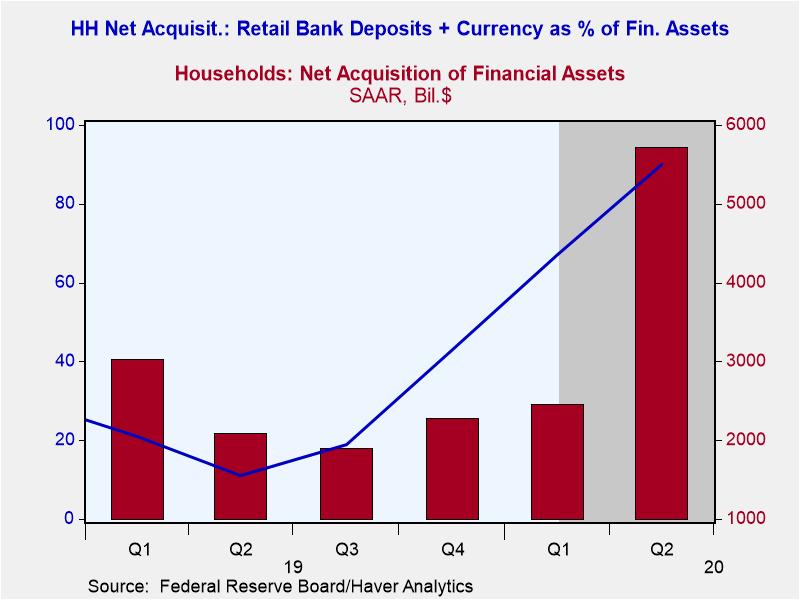
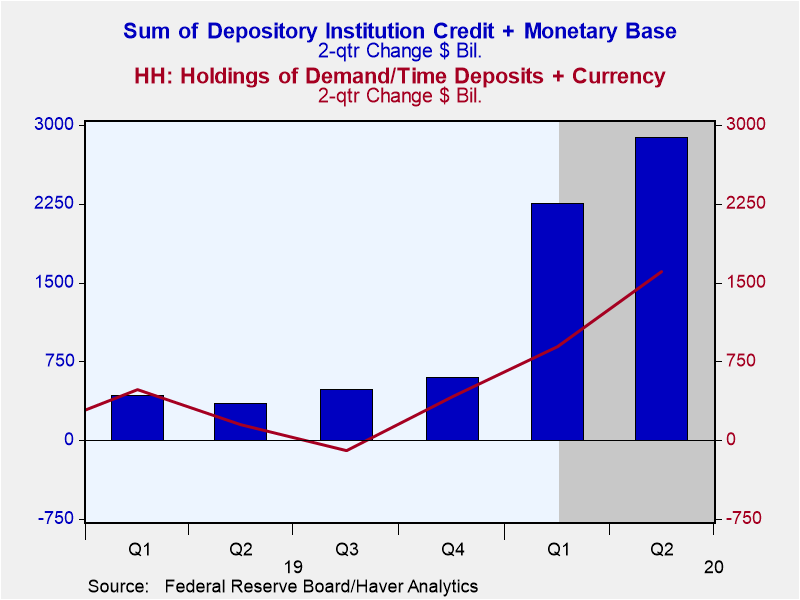
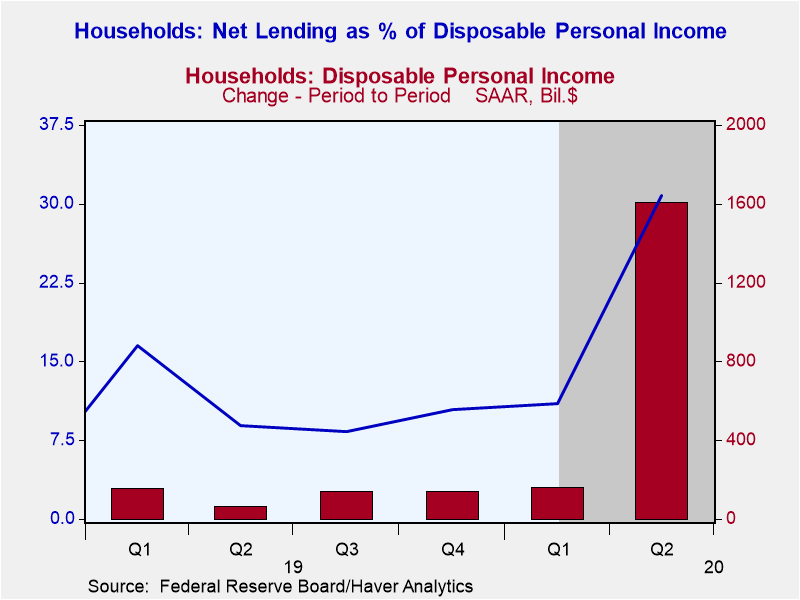 Let's look at households first. As shown in Chart 1, disposable personal income (after-tax household income) soared in Q2:2020, increasing by $1.6 trillion annualized from Q1:2020, as covid-19 income-maintenance programs kicked in. The bulk of these programs were regular unemployment benefits plus the $600 per week "bonus" and the $1,200 per adult/$500 per child "gift". And what did households do with a lot of this extra relief covid-19 income? They saved it. Household net lending in relation to disposable personal income rose to 30.8% in Q2:2020 (the blue line in Chart 1). This saving rate is a record high in the post-WWII era, topping the previous high 0f 22.1% in Q4:2008. Of the net $5.7 trillion annualized of financial assets acquired by households in Q2:2020, 89.9% were retail deposits issued by depository institutions and currency issued by the Fed, essentially M2 money supply assets (see Chart 2 below). And how did this increase in household M2-type assets get created? Out of "thin-air" as a result of depository institutions increasing their earning assets (loans and securities investments) and by the Fed increasing its (hopefully) earning assets, as shown in Chart 3 below.
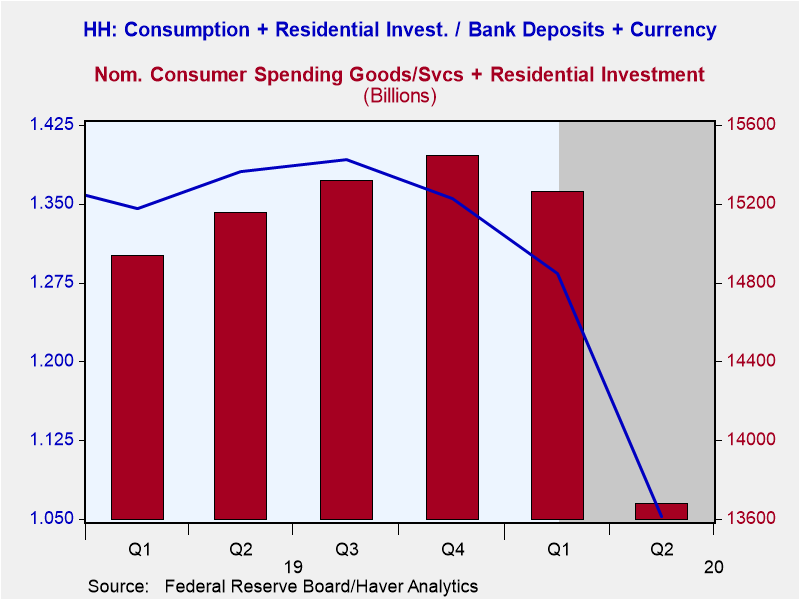 Another way to describe what was happening regarding household acquisition of M2-type financial assets and household spending, or lack thereof, is that there was a severe drop in the "velocity" of household M2 money. This is shown in Chart 4, where I plotted the annualized nominal dollar spending on goods, services and residential investment by households divided by the level of demand/time deposits plus currency owned by households (the blue line). We'll call this the "velocity" of household M-2 money. Also in Chart 4, I plotted the quarterly annualized household nominal dollar spending on goods, services and residential investment. This dropped by $1.6 trillion annualized in Q2:2020 vs. Q1:2020. With the large increase in households' net acquisition of M-2 assets, household M-2 velocity fell from 1.28 in Q1:2020 to 1.05 in Q2:2020, a contraction of 17.99%. At 1.05, this is lowest household M-2 velocity value in the post-WWII era and the lowest since 1.18 in Q4:1986. An intuitive way to think of this decline in velocity is that it represents an increase in households' demand to hold bank deposits and currency. Although the magnitude of this increased demand by households for liquidity might be surprising, given the extreme economic/financial uncertainty caused by covid-19, that households would want to be more liquid is not surprising. Had the Fed and the depository institution system not accommodated households' increased demand for M2-type assets, the contraction in household spending would have been even more severe.
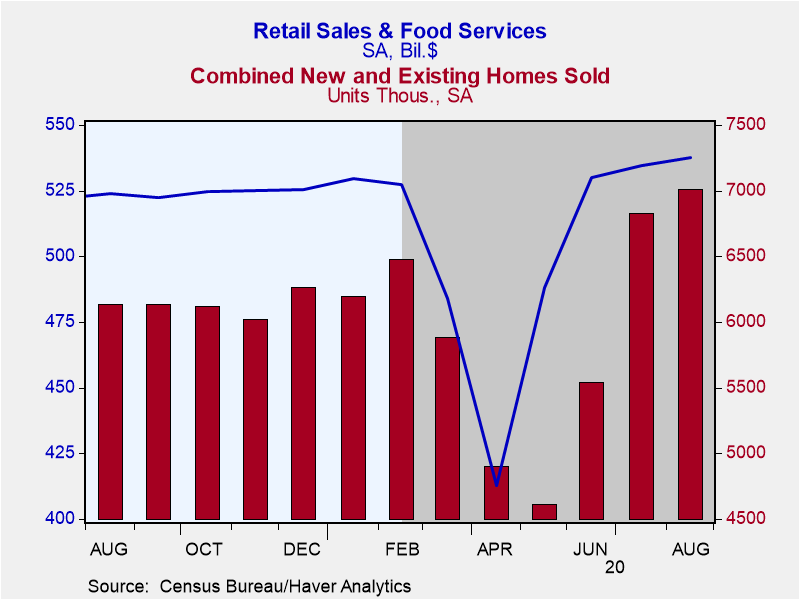
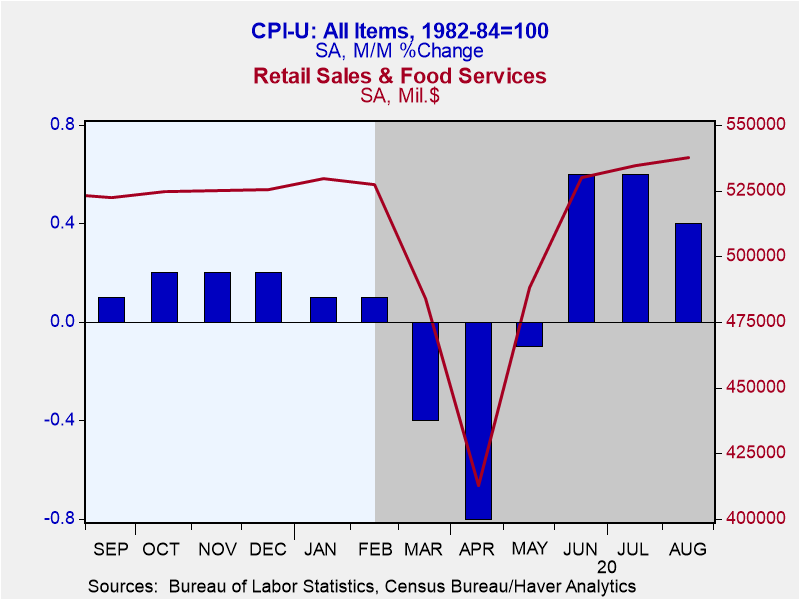
With households holding all these extra liquid assets, they have some extra spending potential going forward, all else the same. All else, of course, is not the same. It would appear that another round of $1,200 per adult/$500 per child federal largesse is not in the cards. And the $600 per week unemployment insurance "bonus" also is a thing of the past. But household spending has picked up as we move through the third quarter as shown in Chart 5 below in which monthly nominal dollar retail sales and unit new plus existing home sales are plotted. Both series have risen above their February pre-covid levels. It is interesting that as retail sales have picked up, so, too, has consumer price inflation, as shown in Chart 6 below. Given the contraction in production in the second quarter, one can only imagine how much consumer price inflation would have increased if households had spent their covid-19 transfer payments rather than hoarding them in bank deposits.
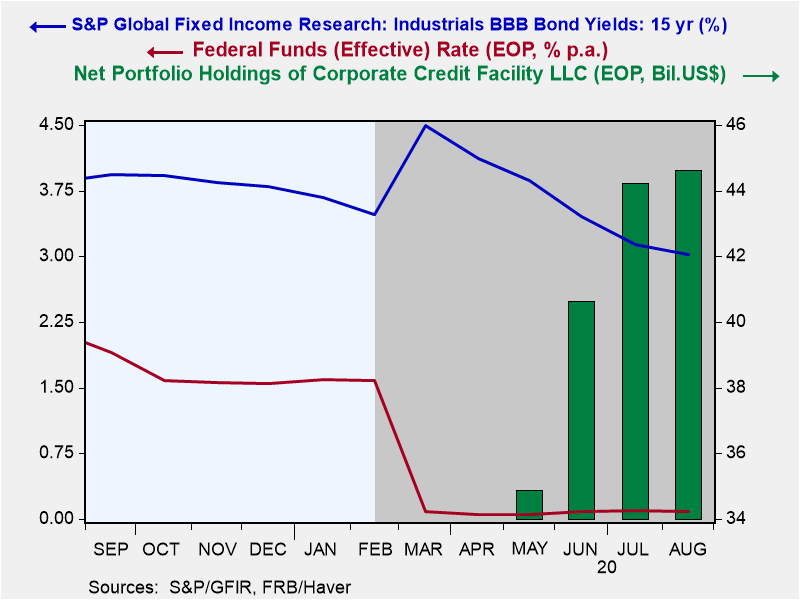
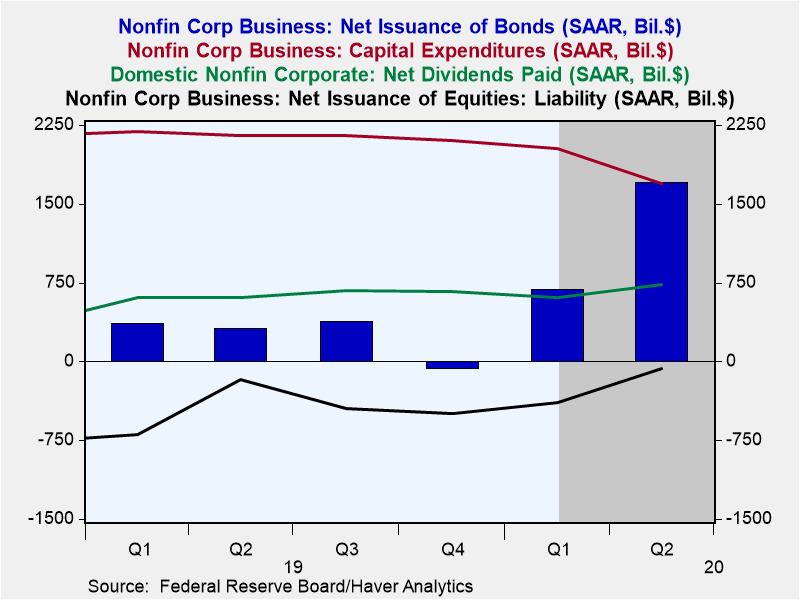
Now, let's see what nonfinancial corporations have been up to. The Fed began lowering the federal funds rate (the red line in Chart 7 below) in March and got the level down to less than 0.10% by April. In May, the Fed began directly aiding the corporate bond market by purchasing corporate issues (the green bars in Chart 7). All of this has helped bring down the yield on the lowest-rated investment-grade corporate bonds to about 3%, the lowest since 1951 (the blue line in Chart 7). If the Fed is going to operate so as to produce the lowest corporate bond yields in 69 years, corporate financial managers are going to make hay while the sun shines. That is, those in the nonfinancial corporate sector increased their bond issuance in Q2:2020 to an annualized pace of $1.7 trillion, about $1 trillion annualized more than in Q1:2020 (the blue bars in Chart 8 below). Did nonfinancial corporations use the proceeds from their massive net new bond issuance to increase their nominal capital expenditures (the red line in Chart 8)? No, nominal capital expenditures slowed in the second quarter of this year. For retirement of equities (the black line Chart 8)? Yes, but much less than in the previous quarter. For payment of dividends (the green line in Chart 8)? Yes, but only marginally more than in the previous quarter.
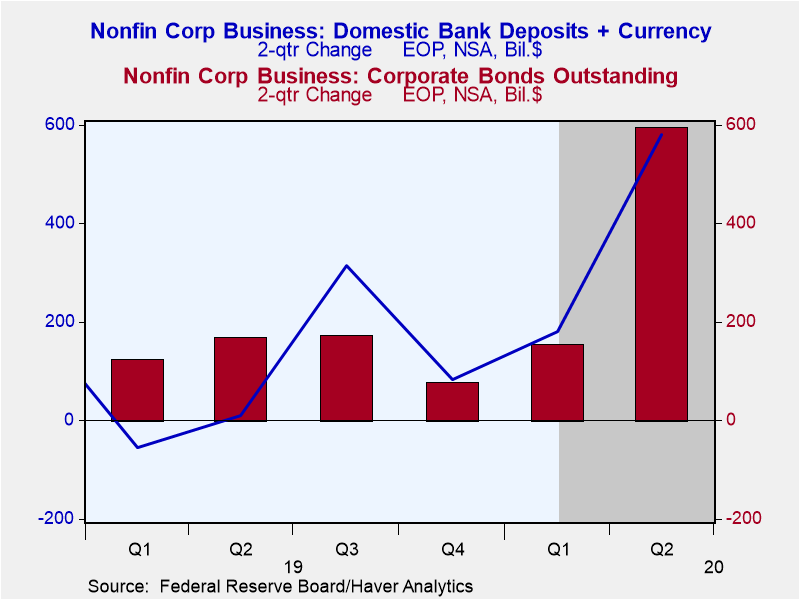 So, what did nonfinancial corporations do with the bulk of the funds they raised through the massive issuance of bonds in the second quarter? In the two quarters ended Q2:2020, nonfinancial corporations bonds outstanding increased by $596 billion, in round numbers (red bars in Chart 9). During this same time period, nonfinancial corporations holdings of domestic bank deposits (checkable and time) and currency increased by $580 billion, in round numbers (blue line in Chart 9). So, like households, nonfinancial corporations have loaded up on cash through the second quarter of this year. It remains to be seen what corporations will do with all this cash sitting in their coffers. My bet is that a lot of it will be used to retire equities when the equity market starts to weaken. Some of the cash might be used to pay operating expenses, such as salaries, if some of these borrowing corporations are not currently and/or will not be able to generate sufficient earnings because of covid-19, in other words, "zombie" corporations.
In sum, the Fed and the depository institution system in the second quarter created the funds, figuratively out of thin air, to pay for the covid-19 federal government transfer payments to households. Households saved a large portion of these government transfer payments in the form of bank deposits and currency. Had these funds not been created out of thin air, the contraction in household spending on goods, services and residential investment would have been even more severe than it was. It would appear that households are beginning to spend in the third quarter some of the cash they hoarded in the second quarter. But with covid-19 government transfer payments having dried up for now (there are reports of negotiations taking place between Congress and the Trump administration to pass a new "skinnier" covid-19 aid program) and with "thin-air" credit growth having stalled, the surge in growth third-quarter of household spending may be short lived. The Fed and the depository institution system also created out of thin air the credit that funded the second-quarter surge in nonfinancial corporate bond issuance. Similar to households, corporations stocked up on cash in the second quarter. Unless corporations perceive that the third-quarter rebound in household spending is more than merely a temporary make-up for the second-quarter contraction, they are unlikely to use their cash cache for capital investment. Rather, corporations will use it to retire equity, pay dividends to stockholders, and cover operating expenses.
Viewpoint commentaries are the opinions of the author and do not reflect the views of Haver Analytics.Paul L. Kasriel
AuthorMore in Author Profile »Mr. Kasriel is founder of Econtrarian, LLC, an economic-analysis consulting firm. Paul’s economic commentaries can be read on his blog, The Econtrarian. After 25 years of employment at The Northern Trust Company of Chicago, Paul retired from the chief economist position at the end of April 2012. Prior to joining The Northern Trust Company in August 1986, Paul was on the official staff of the Federal Reserve Bank of Chicago in the economic research department. Paul is a recipient of the annual Lawrence R. Klein award for the most accurate economic forecast over a four-year period among the approximately 50 participants in the Blue Chip Economic Indicators forecast survey. In January 2009, both The Wall Street Journal and Forbes cited Paul as one of the few economists who identified early on the formation of the housing bubble and the economic and financial market havoc that would ensue after the bubble inevitably burst. Under Paul’s leadership, The Northern Trust’s economic website was ranked in the top ten “most interesting” by The Wall Street Journal. Paul is the co-author of a book entitled Seven Indicators That Move Markets (McGraw-Hill, 2002). Paul resides on the beautiful peninsula of Door County, Wisconsin where he sails his salty 1967 Pearson Commander 26, sings in a community choir and struggles to learn how to play the bass guitar (actually the bass ukulele). Paul can be contacted by email at econtrarian@gmail.com or by telephone at 1-920-559-0375.


