 Global| Aug 26 2019
If Some Bloomberg TV Guest Pundits Were Weather Forecasters, They Probably Would Be Predicting Tomorrow's U.S. [...]
|in:Viewpoints
Summary
The negative differential between the yield on the Treasury 10-year security and the rate on federal funds suggests that, at best, the pace of U.S. economic activity will slow significantly in a few quarters ahead or, at worst, the [...]
The negative differential between the yield on the Treasury 10-year security and the rate on federal funds suggests that, at best, the pace of U.S. economic activity will slow significantly in a few quarters ahead or, at worst, the U.S. economy will slip into a recession a few quarters ahead. Of course, this negative yield differential is not infallible in predicting a recession, but, in my opinion, it is the single best leading indicator of the pace of economic activity. Yet, when I turn on Bloomberg TV and forget to mute the sound (I long ago used the parental discretion setting to block CNBC), I hear pundits saying that there is no sign of a recession because the latest report on U.S. consumer spending showed it to be strong and the latest report on the U.S. unemployment rate showed it to be low and steady. But the pace of consumer spending and the level/movement in the unemployment are, at best, coincident indicators of the pace of economic activity. Looking at coincident indicators to forecast the behavior of the economy is akin to looking east today to get a handle on tomorrow's weather. (You see, in the Northern Hemisphere, weather typically moves from the west to the east.)
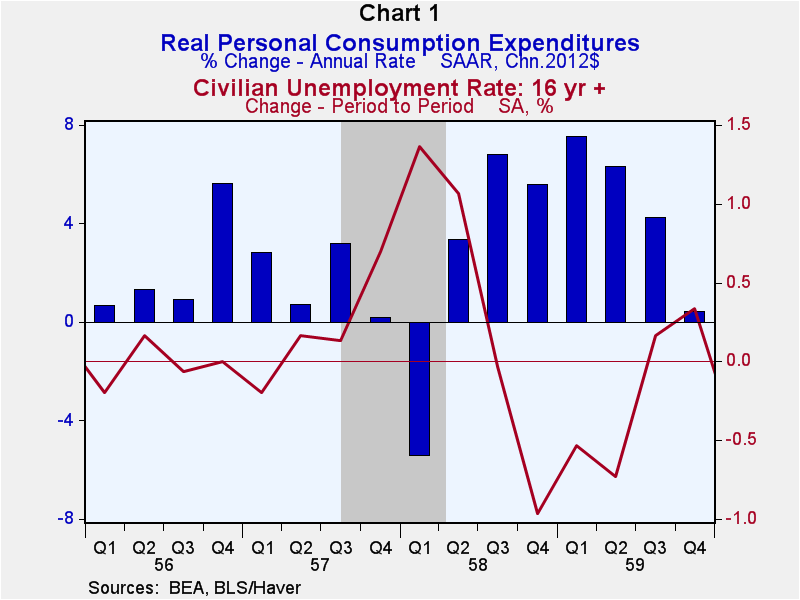
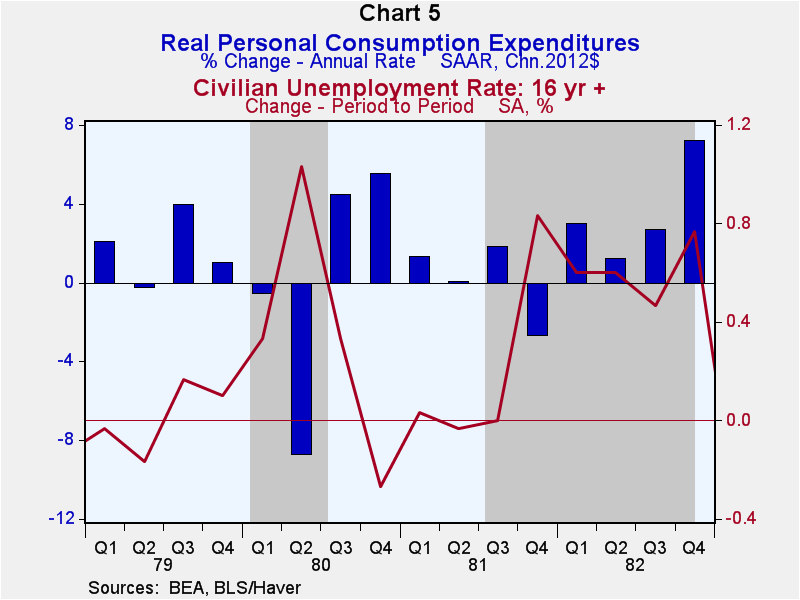
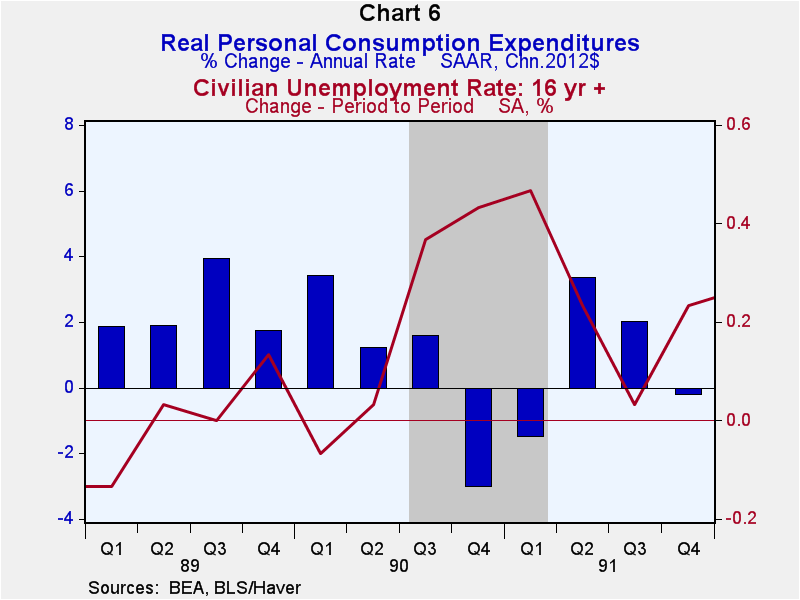
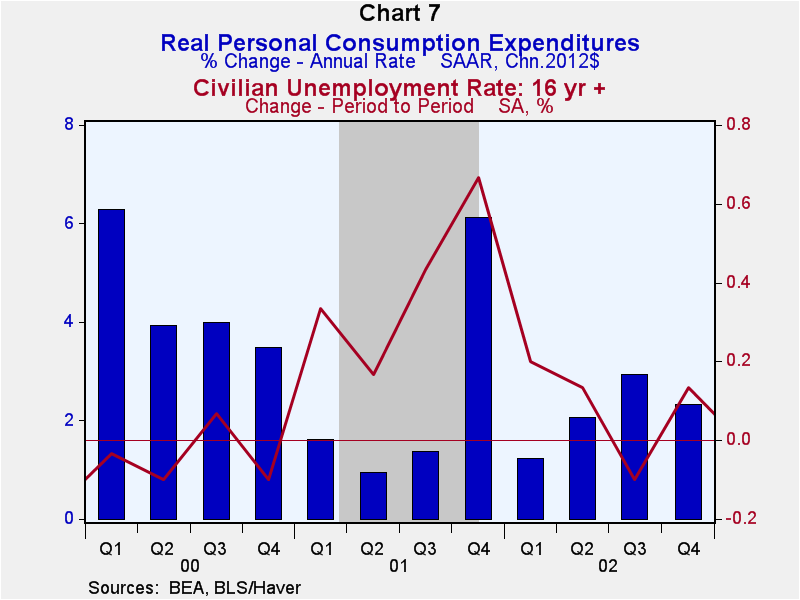
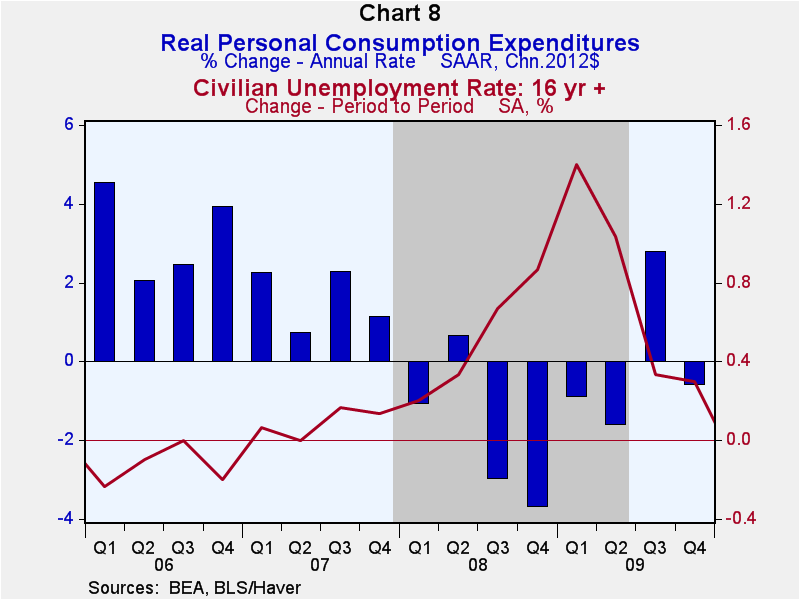
So, let's look at the behavior of real personal consumption expenditures and the unemployment rate around the onset of U.S. recessions, beginning with the 1957-58 recession. Plotted in the charts below are the quarter-to-quarter annualized rates of growth in real personal consumption expenditures (the blue bars) along with the quarter-to-quarter percentage point changes in the quarterly average unemployment rates (the red lines). The grey shaded areas in the charts denote periods of economic recession. Chart 1 is a plot of these variables from Q1:1956 through Q4:1959. In Q3:1957, the quarter in which the U.S. economy entered a recession, real personal consumption expenditures grew at an annualized rate of 3.2%, the fastest rate since that of 5.6% in Q4:1956. So, growth in real consumer spending was relatively strong in the same quarter in which the economy entered a recession! The quarterly average unemployment rate increased by 0.2 of a percentage point and 0.1 of a percentage point in Q2:1957 and Q3:1957, respectively. So, perhaps, one might have sensed an imminent recession based on the behavior of the unemployment rate.
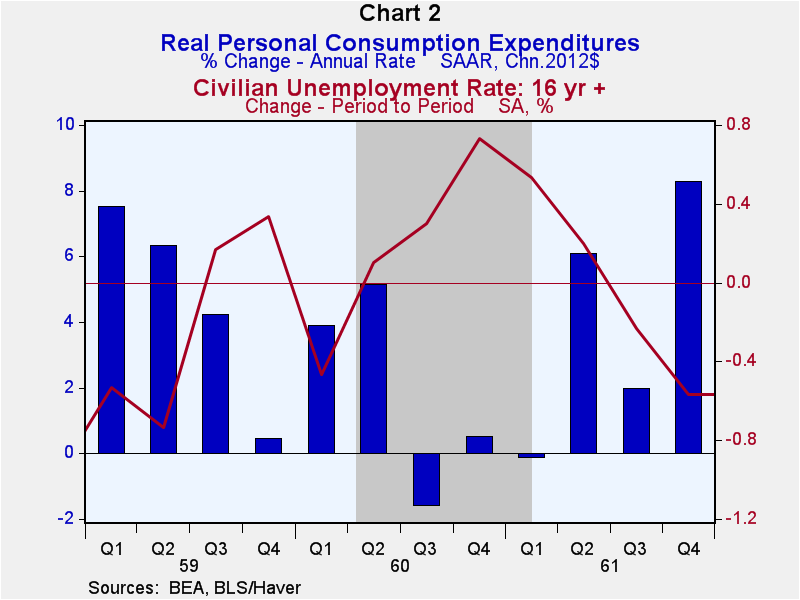
Another recession commenced in Q2:1960 (see Chart 2). Annualized growth in real personal consumption expenditures was 3.9% and 5.2% in Q1:1960 and Q2:1960, respectively. The quarterly average unemployment rate did increase 0.1 of a percentage point in Q2:1960, but that was on the heels of a 0.5 of a percentage point decline the previous quarter. No sign of a recession here, except that one had already commenced in Q2:1960!
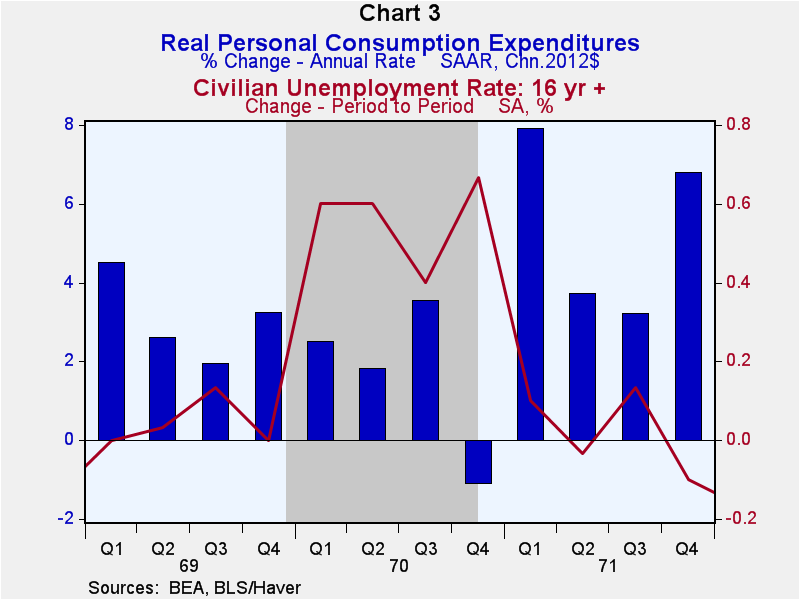
The next recession started in Q4:1969 (see Chart 3). In that quarter, real personal consumption expenditures grew at an annualized rate of 3.2%, up from the previous quarter's growth of 2.0%. The quarterly average unemployment rate reached its cycle low of 3.4% in Q4:1968, remaining there through Q2:1969. The quarterly average unemployment rate rose to 3.6% in Q3:1969, remaining at that relatively low rate in Q4:1969, the quarter the economy entered a recession. Again, neither the behavior of real consumer spending nor the unemployment rate screamed that a recession coming was imminent.
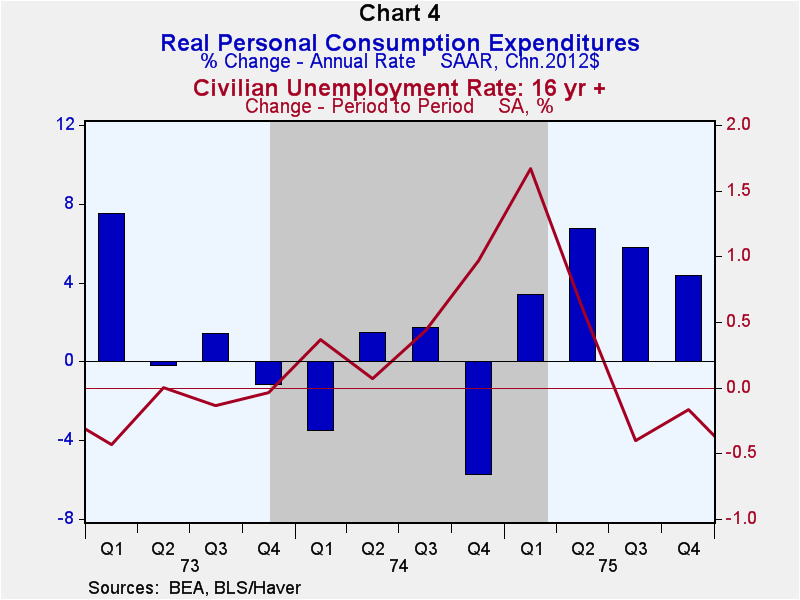
The next recession commenced in Q4:1973 (see Chart 4). The behavior of real personal consumption expenditures had begun weakening significantly in Q2:1973. So, one might have sensed that a recession was imminent based on this. But not based on the behavior of the unemployment rate. It was at its cycle low of 4.8% in Q4:1973, when the economy entered a recession.
The next recessions came in quick succession. The economy entered a short recession in Q1:1980, which lasted only until Q3:1980. Then the economy re-entered a recession in Q3:1981 (see Chart 5). Real consumer spending was sending mixed signals in the runup to the recession. In Q3:1979, real personal consumption expenditures increased at a respectable annualized rate of 3.9%, slowing to 1.0% in Q4:1979. The unemployment rate hit its cycle low of 5.7% in Q2:1979, moving up to 6.0% by Q4:1979. Given that the differential between the yield on the Treasury 10-year security and the rate on federal funds had turned negative in Q4:1978 and was getting progressively more negative quarter to quarter, I suppose one might have interpreted the behaviors of the real consumer spending and the unemployment rate as signals that a recession was imminent. But interpretation of the behavior of real consumer spending and the unemployment rate or not, the behavior of the yield curve had been sending a clear recession warning.
The next recession started in Q3:1990 (see Chart 6). Annualized growth in real personal consumption expenditures did slow to 1.2% in the quarter before the recession, but actually edged higher to 1.6% in the quarter in which the recession commenced, Q3:1990. The unemployment rate did shoot up in Q3:1990, but in Q2:1990, it was only 0.1 of percentage point higher than its cycle low of 5.2%. Again, no strong recession storm warnings sent by the behaviors of real consumer spending or the unemployment rate in the two quarters preceding the onset of a recession.
The next recession started in Q1:2001 (see Chart 7). It was a mini recession in terms of its severity and duration. In fact, it was the only post-WWII recession that did not have two successive quarters of contracting real GDP. In the quarter before the onset of the recession, Q4:2000, the annualized growth in real personal consumption expenditures was a solid 3.5% and the unemployment rate dipped 0.1 percentage points. Again, these coincident variables did not signal a recession.
 And last, but certainly not least, was the Great Recession, which commenced in Q4:2007 (see Chart 8). Annualized growth in real personal consumption expenditures slowed to 0.7% in Q2:2007, but rebounded to 2.3% in Q3:2007, the quarter before the onset of the recession. If you were ignoring the negative differential between the yield on the Treasury 10-year security and the rate on federal funds, you might have written off the behavior of real consumer spending as “noise”. The behavior of the unemployment rate, however, was signaling that something ominous was coming for the economy. After hitting a cycle low of 4.4% in Q4:2006, the unemployment rate had risen to 4.7% in Q3:2007.
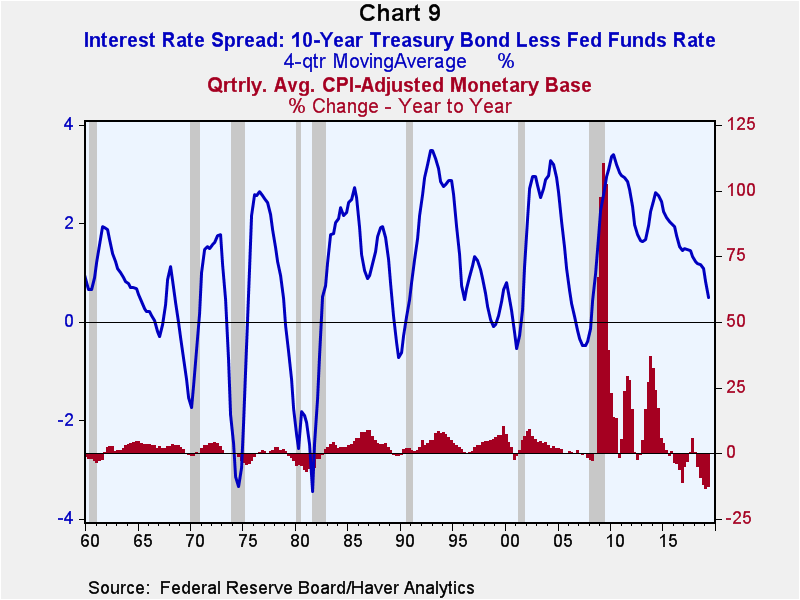
In sum, looking at the behavior of coincident indicators such real consumer spending or the unemployment rate has been unreliable in forecasting the onset of a recession. This would be akin to forecasting tomorrow's weather by looking out the east window. Metaphorically speaking, recession forecasters would do better by looking west to observe the behavior of the differential between the yield on the 10-year Treasury security and the rate on federal funds and the behavior of the CPI-adjusted monetary base (see Chart 9).
Viewpoint commentaries are the opinions of the author and do not reflect the views of Haver Analytics.Paul L. Kasriel
AuthorMore in Author Profile »Mr. Kasriel is founder of Econtrarian, LLC, an economic-analysis consulting firm. Paul’s economic commentaries can be read on his blog, The Econtrarian. After 25 years of employment at The Northern Trust Company of Chicago, Paul retired from the chief economist position at the end of April 2012. Prior to joining The Northern Trust Company in August 1986, Paul was on the official staff of the Federal Reserve Bank of Chicago in the economic research department. Paul is a recipient of the annual Lawrence R. Klein award for the most accurate economic forecast over a four-year period among the approximately 50 participants in the Blue Chip Economic Indicators forecast survey. In January 2009, both The Wall Street Journal and Forbes cited Paul as one of the few economists who identified early on the formation of the housing bubble and the economic and financial market havoc that would ensue after the bubble inevitably burst. Under Paul’s leadership, The Northern Trust’s economic website was ranked in the top ten “most interesting” by The Wall Street Journal. Paul is the co-author of a book entitled Seven Indicators That Move Markets (McGraw-Hill, 2002). Paul resides on the beautiful peninsula of Door County, Wisconsin where he sails his salty 1967 Pearson Commander 26, sings in a community choir and struggles to learn how to play the bass guitar (actually the bass ukulele). Paul can be contacted by email at econtrarian@gmail.com or by telephone at 1-920-559-0375.


