 Global| Aug 19 2020
Ramblings of a Congenital Pessimist
|in:Viewpoints
Summary
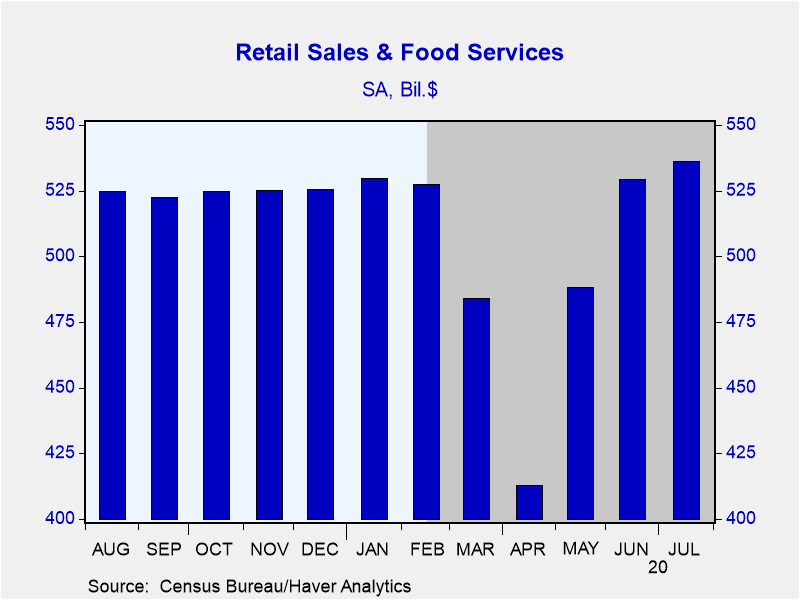
What follows are my comments on various US economic data that have been released recently. Let's start with July 2020 nominal retail sales. As shown in Chart 1, the level of July nominal retail sales exceeded its pre-COVID level set [...]
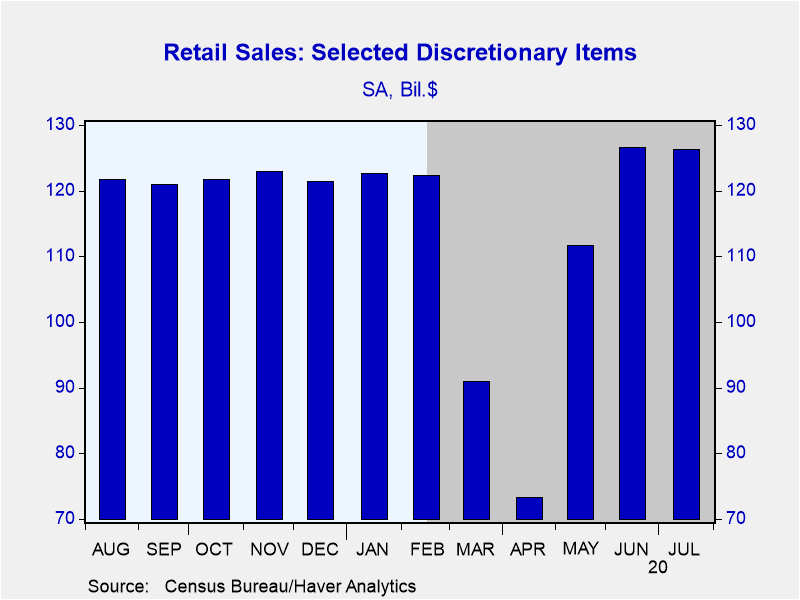
What follows are my comments on various US economic data that have been released recently. Let's start with July 2020 nominal retail sales. As shown in Chart 1, the level of July nominal retail sales exceeded its pre-COVID level set back in January. It is not surprising that nominal retail sales have made up their initial COVID contraction given the extraordinary boost to personal (household) income provided by special federal government COVID transfer payments and regular state unemployment insurance benefits. As I reported in my August 3, 2020 commentary "Second Quarter Government Transfer Payments Likely Took the Edge Off Covid-19" personal income grew at a record annualized 32.6% in Q2:2020. Without these COVID transfer payments, personal income would have contracted at record annualized rate of 19.1%. I suppose it also is not surprising that what I would consider to be discretionary consumer purchases have made up all of their COVID contractions, given how generous these transfer payments were. This is shown in Chart 2 in which is plotted the monthly sums of retail sales of motor vehicle dealers, furniture, home furnishing, electronics and appliance stores and sporting goods, hobby, book and music stores. With the special federal COVID transfer payments having expired, retail sales likely will be considerably less robust in the coming months.
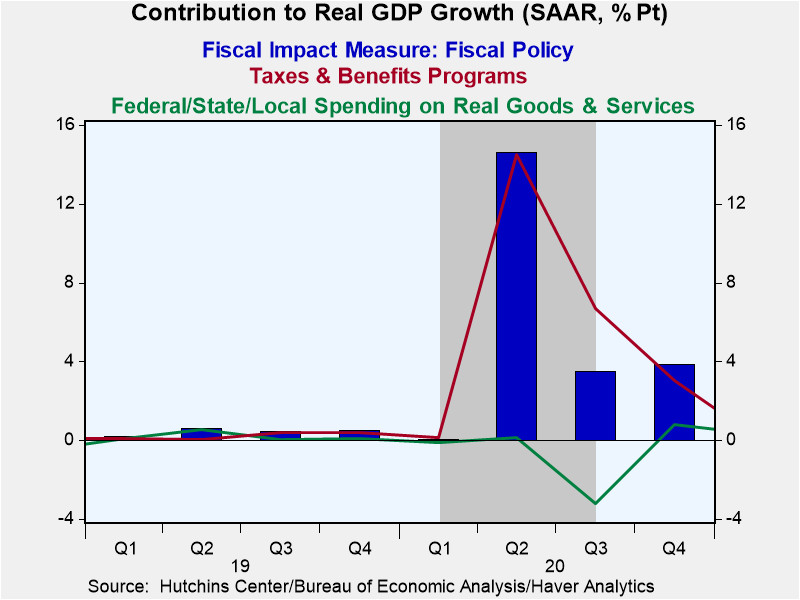
While on the subject of how much special federal COVID programs boosted personal income in the second quarter, let's look at a measure of how much government fiscal programs boosted real GDP growth above its potential in the second quarter. Such a measure is called Fiscal Impact Measure (FIM). The FIM is a tool created by the (Brookings) Hutchins Center to illustrate how much local, state and federal fiscal policy adds to or subtracts from overall economic growth. When the FIM is positive, policy is expansionary in the sense that it is pushing growth in real Gross Domestic Product (GDP) above its longer-run potential. When the FIM is negative, policy is lowering real GDP growth relative to potential. The FIM is broader than measures of fiscal impetus that rely on the size of the federal deficit because it includes the the direct effects of federal, state, and local government purchases as well as the more indirect effects of government taxes and government transfers, which affect private consumption. The total FIM contributions to real GDP growth data are plotted in Chart 3 (the blue bars) along with the contributions from government tax and benefit programs (the red line) and combined federal/state/local government spending on goods and services (the green line). Concentrate on Q2:2020 because the later 2020 data are pure guesstimates. The total FIM in Q2:2020 was 16.62%, composed of 16.48% from government tax and transfer programs, primarily transfer programs, and a mere 0.14% from government spending programs.
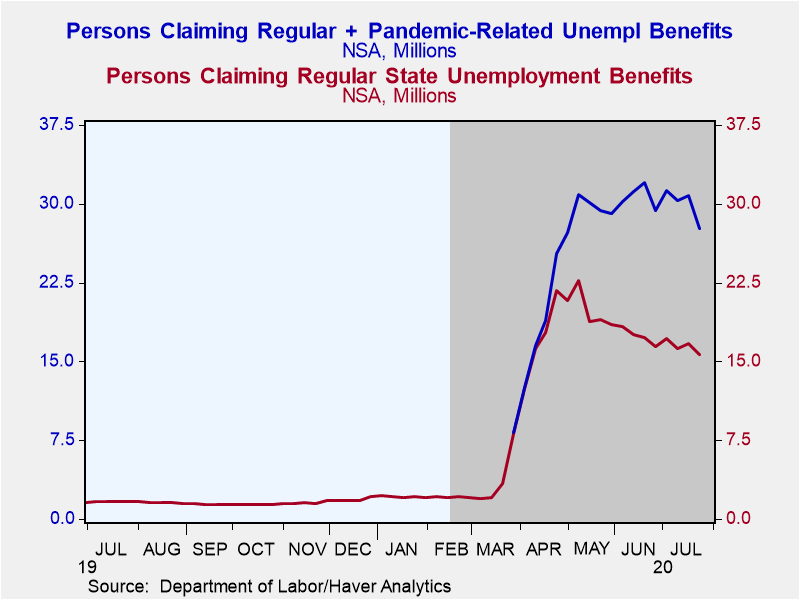
With persons claiming regular state unemployment benefits plus special pandemic-related unemployment benefits totaling 27.7 million in the week ended July 24, 2020 (see Chart 4), it will be interesting to see how retail sales hold up in the months ahead with the $600-a-week "bonus" having expired at the end of July and no more $1,200 per adult/$500 per kid "gifts" from Uncle Sam scheduled again as of this writing. In other words, unless employment explodes to the upside in the near term, personal income is likely to fall and so, too, retail sales. By the way, the data in Chart 4 represent real people collecting unemployment benefits. The data are not "blown up" from a random sample. The data are not seasonally adjusted. The data are not "misclassified".
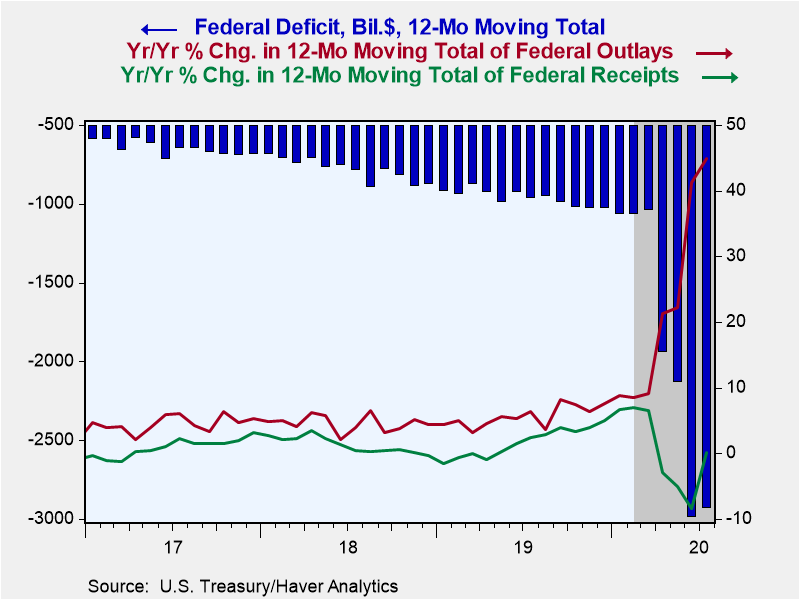
Let's check in with federal budget finances. In the 12 months ended July 2020, the cumulative federal budget deficit was $2.925 trillion, a slight narrowing from the 12-month cumulative deficit of $2.982 trillion in June (see Chart 5). Starting in October 2019, the 12-month cumulative federal budget deficit hit the big number of $1 trillion. Then in April 2020, the 12-month cumulative deficit nearly doubled as pandemic emergency federal transfer spending exploded and federal receipts collapsed, in part due to the income-tax-payment deferral until July 2020. (See Chart 5 for the year-over-year percent changes in the 12-month moving totals of federal outlays and receipts).
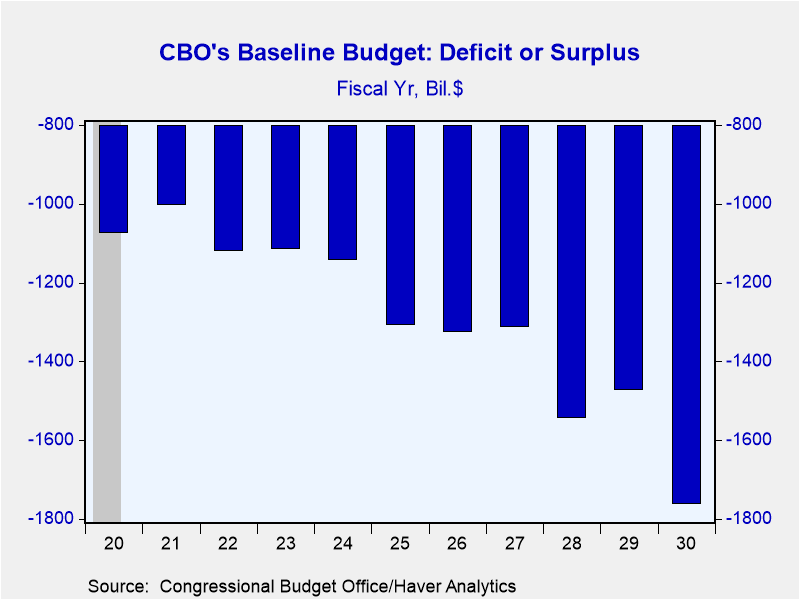
Now, the emergency pandemic federal spending is likely to be a one-off type of event. So, the federal deficit in the next few years is expected to narrow from its nearly $3 trillion current shortfall. But remember, back in mid March, before the emergency pandemic federal transfer spending commenced, the nonpartisan Congressional Budget Office (CBO) was forecasting persistent federal deficits in excess of $1trillion through fiscal year 2030 (see Chart 6). And these projected deficits do not include the increases in federal infrastructure spending that both major political parties "promise" to enact. Of course, these projected federal deficits also do not include the tax increases one major political party "promises" to enact.
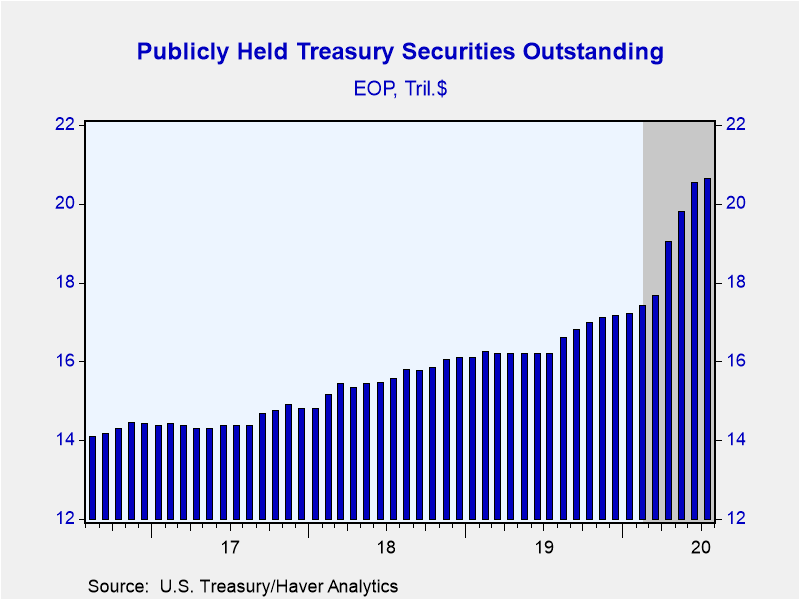
There's and old saying, which may be apocryphal, that every ounce of gold that has ever been mined still is in existence. It is almost the same for government debt inasmuch as governments seldom run surpluses in the "modern" era. Although the current federal deficit is only temporarily near $3 trillion because of emergency pandemic spending, the increased debt associated with the current federal deficit is not going away in my grandchildren's lifetimes. At the end of July, the federal debt held by the public stood at $20.6 trillion (see Chart 7). To put this into perspective, nominal GDP in 2019 was $21.4 trillion. The federal debt held by the public increased by $3 trillion in round numbers in the four months ended July. That same CBO federal budget forecast made back in mid March projected federal debt held by the public would stand at $31.3 trillion at the end of fiscal year 2030. I'll see your $31.3 trillion and raise you $3 trillion.
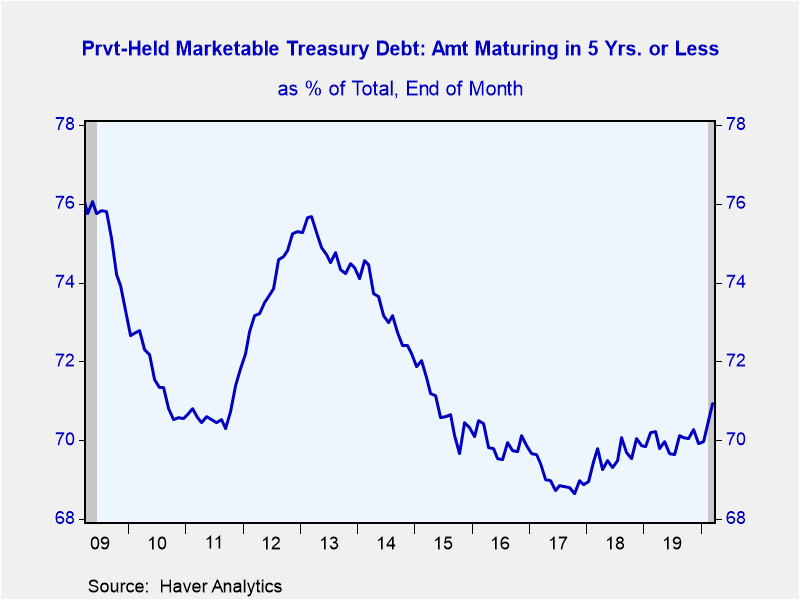
The reason I bring up the federal deficit and debt is that I believe a year or two down the road managing these deficits and debt is going to be a "problem". The problem will be that the structure of interest rates will "want" to move higher in the presence of rising private credit demands and persistent high federal government credit demands. Unless the current $3 trillion of federal debt held by the public have been financed with long maturities, massive amounts of outstanding debt will have to be refinanced in the coming years. As shown in Chart 8, at the end of March 2020, 71% of outstanding marketable Treasury debt privately held had a maturity of five years or less. If I am right that the structure of interest rates will "want" to rise, then massive amounts of maturing Treasury debt would have to be refinanced at higher interest rates. This would amplify federal government spending going forward because of increased debt-servicing expenses. And, all else the same, this would increase the ratio of federal debt-to-GDP.
How could the Treasury avoid this scenario? One way would be to raise taxes. That's not a politically popular solution. Popular or not, taxes almost assuredly will rise, but also almost assuredly, not enough to forestall this scenario. Another politically-unpopular option would be to cut federal spending. But because the non-interest federal spending that will be increasing the most in the coming years is Social Security and Medicare spending, it is highly unlikely that federal spending will be cut enough to forestall this scenario. So, what's left? How about pressuring the Fed to hold down the levels of interest rates beyond the level of the overnight rate, maybe out to the five-year maturity range? During and immediately after WWII, the Fed put a ceiling on both Treasury bill interest rates and Treasury bond interest rates. For reasons other than keeping interest rates low in order to keep federal debt-servicing expenses from exploding, Fed Governor Brainard suggested in a speech made on November 26, 2019, that the Fed might want to explore a policy of yield-curve control.
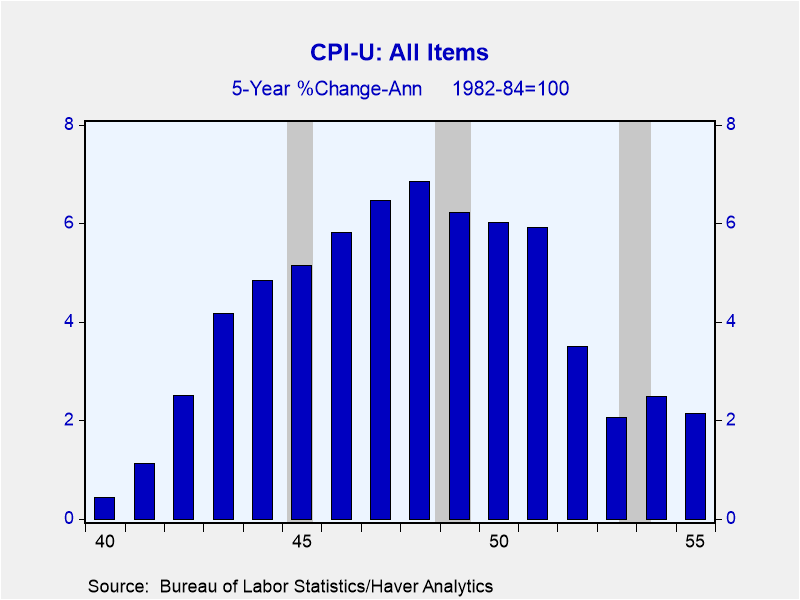
But if the Fed were to hold the structure of interest rates below its "natural" level, would that not result in higher inflation? Yep. Higher inflation is the politically easiest way to stabilize or bring down the ratio of federal debt-to-nominal GDP. Higher inflation results in nominal GDP growing faster than nominal debt. Hence, the ratio declines. The extraordinarily high ratio of federal debt-to-GDP after WWII was brought down by a combination of high taxes, cuts in federal spending and somewhat higher inflation (see Chart 9). Measured CPI inflation would have been higher during WWII if it had not been for federally-mandated price controls.
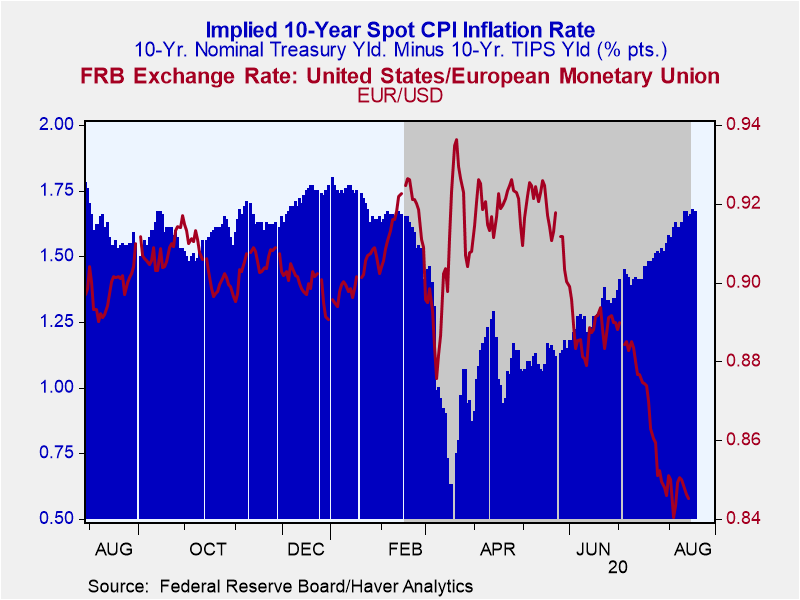
Although I doubt it, but the recent behavior of some financial markets makes me wonder if market participants are beginning to price in my scenario of higher inflation to stabilize the ratio of federal debt-to-GDP. To wit, the implied 10-year CPI inflation rate has begun to rise (see Chart 10). At the same time, the foreign-exchange value of the US dollar has fallen against the Euro (again, see Chart 10). If the Fed were to acquiesce to creating higher inflation in order to stabilize or bring down the ratio of federal debt-to-GDP, then it would be expected that the foreign-exchange value of the US dollar would decline against currencies in which their central banks would not engage in similar inflationary policies. The European Central Bank has a reputation for having a low tolerance for higher inflation. If I am right that the Treasury is going to employ higher inflation in order to stabilize the ratio of federal debt-to-GDP, then you have not seen anything yet regarding the decline in the foreign-exchange value of the US dollar. The dollar's role as the sole reserve currency will be challenged.
So, that's it, the ramblings of a congenital pessimist. Remember what Joost Swarte said: "For most of human history, it made good adaptive sense to be fearful and emphasize the negative; any mistake could be fatal".
Viewpoint commentaries are the opinions of the author and do not reflect the views of Haver Analytics.Paul L. Kasriel
AuthorMore in Author Profile »Mr. Kasriel is founder of Econtrarian, LLC, an economic-analysis consulting firm. Paul’s economic commentaries can be read on his blog, The Econtrarian. After 25 years of employment at The Northern Trust Company of Chicago, Paul retired from the chief economist position at the end of April 2012. Prior to joining The Northern Trust Company in August 1986, Paul was on the official staff of the Federal Reserve Bank of Chicago in the economic research department. Paul is a recipient of the annual Lawrence R. Klein award for the most accurate economic forecast over a four-year period among the approximately 50 participants in the Blue Chip Economic Indicators forecast survey. In January 2009, both The Wall Street Journal and Forbes cited Paul as one of the few economists who identified early on the formation of the housing bubble and the economic and financial market havoc that would ensue after the bubble inevitably burst. Under Paul’s leadership, The Northern Trust’s economic website was ranked in the top ten “most interesting” by The Wall Street Journal. Paul is the co-author of a book entitled Seven Indicators That Move Markets (McGraw-Hill, 2002). Paul resides on the beautiful peninsula of Door County, Wisconsin where he sails his salty 1967 Pearson Commander 26, sings in a community choir and struggles to learn how to play the bass guitar (actually the bass ukulele). Paul can be contacted by email at econtrarian@gmail.com or by telephone at 1-920-559-0375.


