 Global| Oct 15 2020
So What Now?
by:Andrew Cates
|in:Viewpoints
Summary
Lockdown, social distancing, an R rate north of one, contact tracing and herd immunity. Most folks who read these words a few months ago would have little idea about what was being discussed. Fast forward to today and those same words [...]
Lockdown, social distancing, an R rate north of one, contact tracing and herd immunity. Most folks who read these words a few months ago would have little idea about what was being discussed. Fast forward to today and those same words are now sufficient to ignite alarm, anxiety and angst. Nearly everyone now knows what they mean and what they imply. And for those policymakers who are charged with enacting a response to the virus and who are accustomed to cheerleading economic growth they are the stuff of nightmares.
But what should now be done? This short note will not offer any definitive answers. Indeed somewhat unhelpfully it will – on the whole – simply reinforce the idea that there are no easy answers. Many countries, both large and small, are now in the throes of a second wave of COVID-19. Partly because this is generating more stringent policies, that's yielding reduced mobility among populations in some of those countries. And the cross-country evidence that we present below suggests that will almost certainly slow economic activity over the remainder of this year.
What's much less clear cut from the incoming data is what the right policy mix between virus containment and protecting the economy should now be. Some observers believe the former implies longer-term protection for the latter. Other observers believe the reverse and - via a herd immunity argument - that freeing up the economy will eventually see off the virus. Dissecting the data in order to assist with this debate is not easy*. While there is a clear and obvious trade-off between policy stringency, reduced mobility and economic growth, the cross-country data do not yet suggest any clear-cut trade-off between policy stringency and virus containment. However, that may be in part because that bivariate analysis ignores the contribution of other factors. For example social distancing that is voluntary and independent of any policy response is somewhat easier to incentivise in more advanced economies.
What is increasingly clear is that uncertainty about the virus – its duration and its impact – are liable to remain extremely high in the period ahead. That will naturally have implications for the world economy and the fiscal and monetary policy response. The longer-term legacies of the virus, such as higher structural unemployment and higher levels of debt, may also come into much sharper focus for policymakers too.
In what follows we discuss some of these observations and views in more detail.
Global case numbers are accelerating again
First, by way of background, we note that global case numbers have continued to climb in recent weeks, or more pertinently, accelerated. The World Health Organisation (WHO) specifically reported a new record high for global weekly incidence on October 12th for the fourth consecutive week and with a global total that reached more than 2.25 million cases. That's an increase of nearly 10% over the previous week.
Figure 1: Global case numbers versus the death to cases ratio
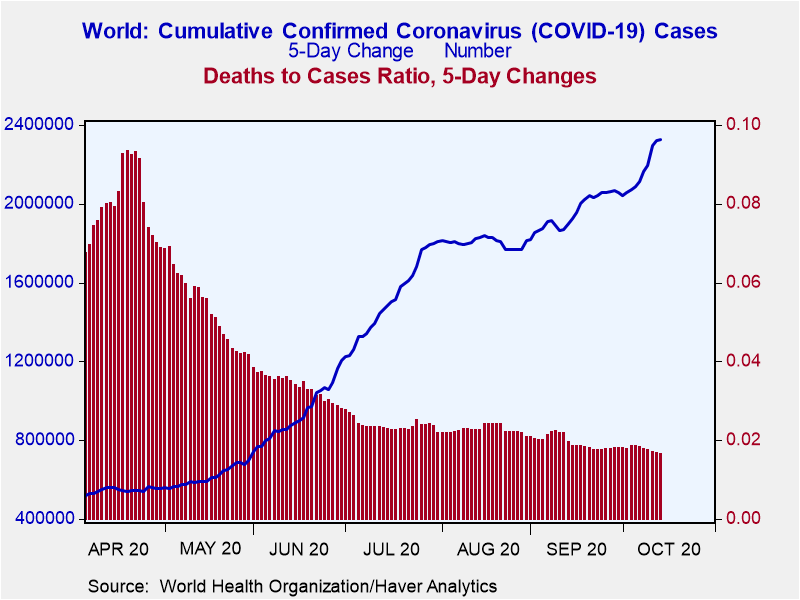 On a more positive note mortality rates remain much lower than they were earlier this year as evidenced in Figure 1. That may in part be because the age distribution for COVID-19 cases has shifted toward younger adults in many countries over the past several months. And, as is now well known, recovery rates in younger cohorts of the world's population are much higher relative to older cohorts. Treatment of the virus has arguably become more effective too.
In which countries are COVID-19 risks presently the highest?
Which countries though are now looking more precarious? We can of course answer this in a number of ways contingent on one what might mean by precarious. But there is a new indicator – the Risk of Openness Index – published by the UK's University of Oxford (and now stored in Haver's ESG Database) that offers some neat perspective on the issue in cross-country comparisons. For the record the index is based on recommendations set out by the WHO of the measures that should be put in place before COVID-19 response policies can be safely relaxed. It calculates a measure of risk that a country faces from adopting an ‘open' policy stance, that is: one that does not include policy measures to contain the virus through physical distancing measures. The index ranges from 0 to 1 with the higher the index the greater the risk of viral transmission absent offsetting policy responses.
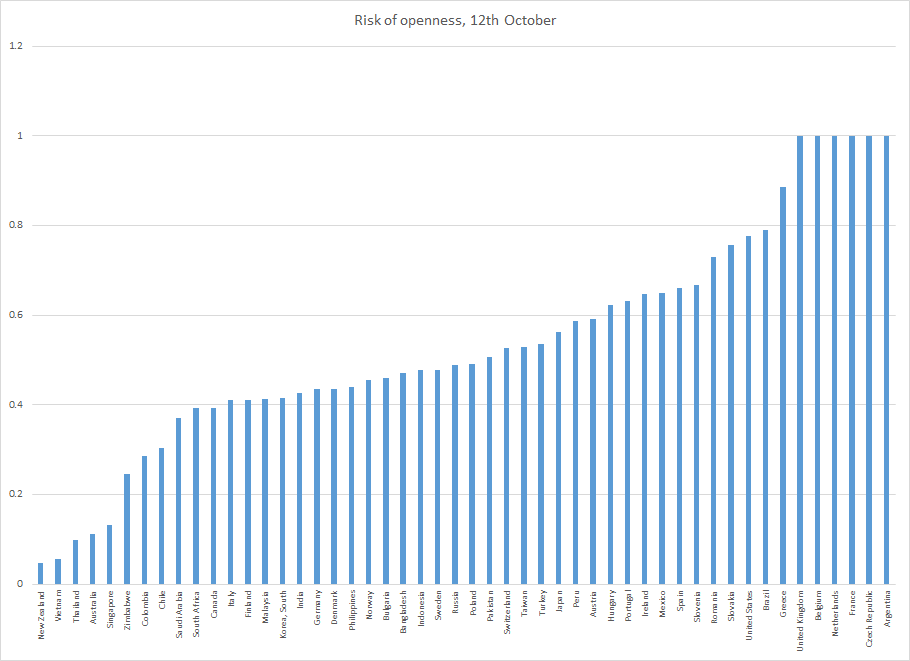
Based on data to October 12th this index presently shows that a number of large European economies including France, the UK and the Netherlands find themselves in a relatively precarious position. Outside of Europe and among the list of larger developed and developing countries that we chose to illustrate this data for in Figures 2 and 3 below, Argentina and the Czech Republic are in the high risk category as well. In contrast several south-east Asian countries including Vietnam, Singapore and Thailand along with Australia and New Zealand appear – according to this index – to be at a much lower level of risk.
Figure 2: COVID risk of openness index for selected developed and developing economies
Source: Oxford University/Haver Analytics
Figure 3: COVID risk of openness, latest levels versus changes
Source: Oxford University/Haver Analytics
How are various economies faring in mobility?
The economic impact of this resurgence in the virus will clearly hinge on a number of factors and most importantly the policy response. Locking populations down and hindering their underlying movements obviously hampers economic activity. And this is why many analysts have been looking much more closely at metrics that measure that mobility. A number of these are stored in Haver's Transport (TRANSPRT) database but we've focused in what follows on the Google variant in part because of the relatively rich sector specifics that these data offer.
For the record Google measures visitor numbers to specific categories of location (e.g. homes, grocery stores; parks; train stations etc.) every day and compares this change relative to a baseline day before the pandemic outbreak. Baseline days represent a normal value for that day of the week, given as the median value over the five week period from January 3rd to February 6th 2020. Measuring it relative to a normal value for that day of the week is helpful because people obviously often have different routines on weekends versus weekdays.
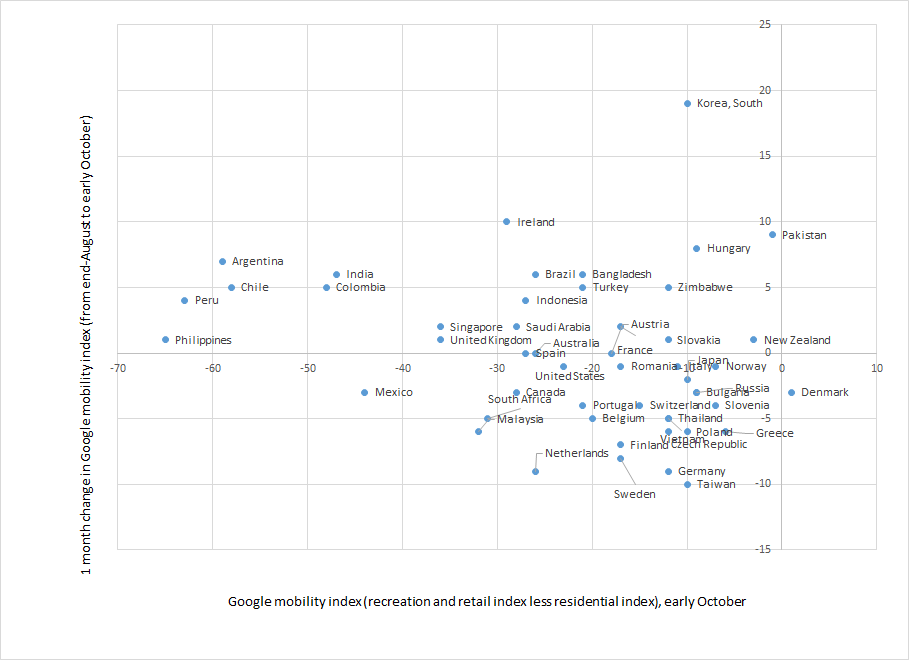
In figures 4 and 5 below we show the gap – both in levels and their one month changes - between the Google mobility index for recreation and retail outlets minus the index for residential establishments. A less negative level of this gap ought to indicate greater mobility amongst the underlying population – e.g. a greater willingness to head out to the shops relative to staying at home.
There are some further caveats to this that we should emphasise however. Firstly, cross-country comparisons are more difficult in this area because in some countries there will be a higher proclivity in the winter months to stay indoors when the weather is poor relative to where there might be a lower proclivity at the same time as this to head outside in the summer months because the weather is good. And secondly and clearly related to this, changes in numbers are measured in this index relative to a baseline period between January and February 2020. This means changes in movement may reflect seasonal factors (e.g. warmer or colder weather) rather than being fully explained by changes due to the pandemic. Still, measured this way and with those caveats in mind we can see that mobility in some economies appears to be much more restrictive relative to others. That will be partly a function of relative policy stringency, partly a function of seasonal factors and partly a function of relative fear.
Figure 4: Google mobility indicators for selected developed and developing economies
Source: Google/Haver Analytics
Figure 5: Mobility indicators, latest levels versus changes
Source: Google/Haver Analytics
Mobility versus growth versus stringency
Notwithstanding all the caveats above, what does seem clear cut is that reduced mobility – as measured – restricts economic activity. In figure 6 below we show the correlation between the degree of mobility in any country and the decline in GDP that unfolded in Q2.
Figure 6: Mobility versus growth
Source: Google/National sources/Haver Analytics
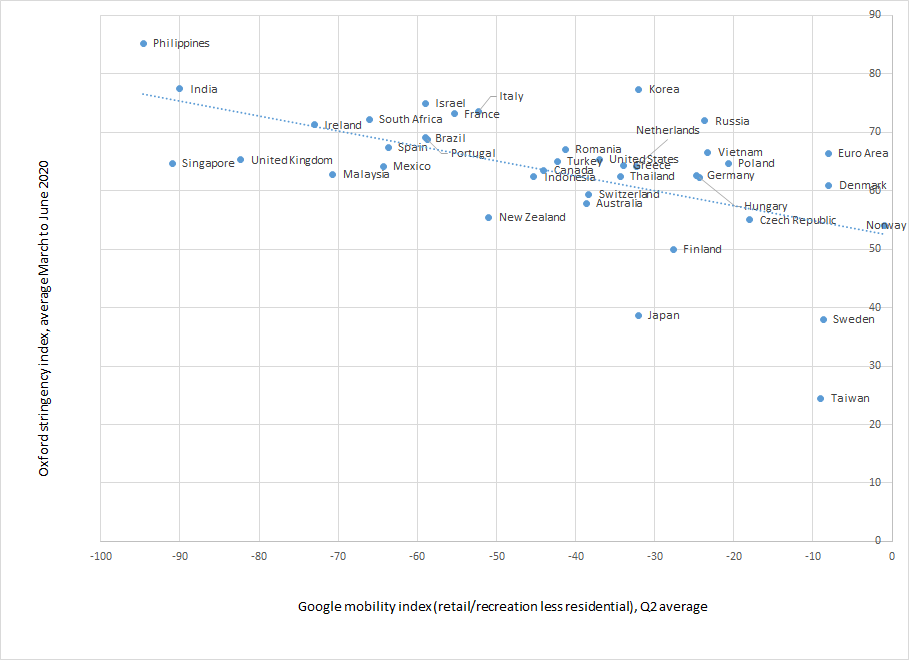
In figure 7 below we further show the negative association that exists between the degree of mobility and the degree of stringency of a country's lockdown response. The latter for the record is measured with respect to Oxford University's Stringency index – also available in Haver's ESG database. The higher that index the more restrictive the policies are in relation to things like school closures, retail restrictions, gatherings of large numbers etc.
While there is clearly a negative association in the chart below, the overall correlation is not that high. And a key reason for this probably concerns the factors that affect mobility. Some of these are seasonal, as we discussed above. But some of them are also voluntary and independent of policy. Decisions to work from home, for example, which restrict mobility, but which enhance social distancing could be related to fear, to one's preferences, to the quality of the IT infrastructure that exists at home, or even from a need to look after one's children. They could moreover reflect country norms and the relative ease with which a society accepts voluntary lockdown restrictions. Sweden is often held up as a bellwether in this regard. It's notable therefore that its stringency index in Q2 2020 would be associated with much more mobility in other countries based on the correlations that we can observe in the figure below.
Figure 7: Mobility versus stringency
Source: Google/Oxford University/Haver Analytics
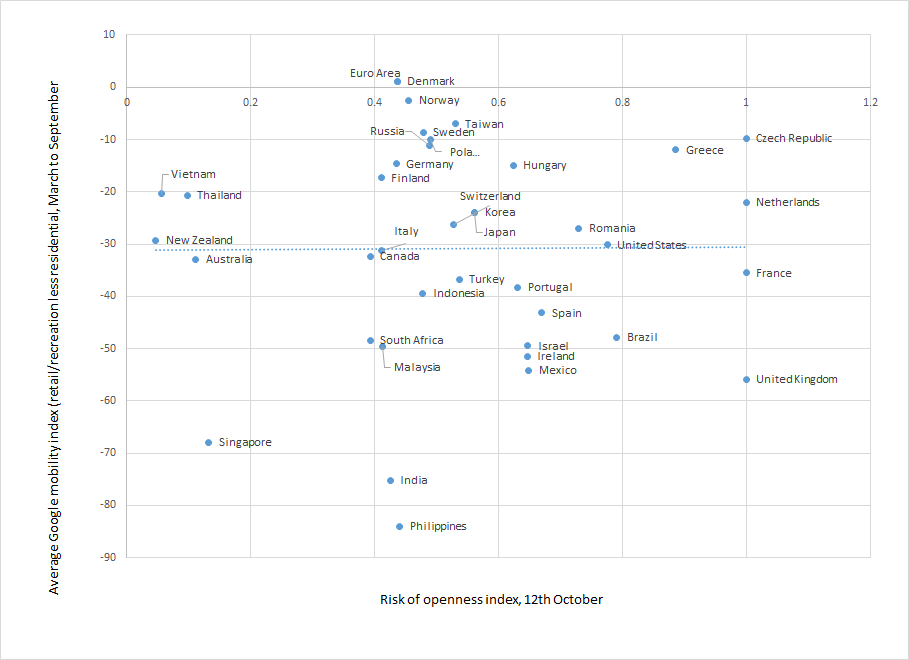
Much of this guards against any firm conclusions that one, in turn, might draw from our final chart in figure 8 below. This shows average levels of our mobility indicator from March through to September relative to the latest COVID-19 risk of openness indicator that we illustrated above. It suggests - at face value - that countries that have seen relatively high mobility don't necessarily face any lower (or higher) COVID risks relative to those that have seen relatively low mobility. But that does not mean that relative mobility does not affect COVID-19 incidence levels. Aside from the issues that we've discussed concerning cross country comparisons, that's because there are many other factors that affect COVID-19 transmission.
Figure 8: Mobility versus COVID risk
Source: Oxford University/Google/Haver Analytics
The bottom line
What's the bottom line? If there is a clear-cut macroeconomic conclusion from this, it is that, ahead of the successful rollout of a vaccine, uncertainty about the outlook and the policy response to the virus are liable to remain extremely high. In those countries where virus incidence levels are rising, the combination of voluntary social distancing, via heightened fear or otherwise, combined with a likely tighter degree of lockdown stringency are bound to take a toll on economic growth. GDP growth forecasts in those countries for Q4 2020 and possibly Q1 2021 may well be marked down. On the policy front any premature withdrawal of fiscal or monetary policy assistance may prove politically as well as economically challenging. Much more focus in the meantime on some of the longer-term consequences of the virus, such as higher rates of structural unemployment and high levels of debt, may become more necessary as well.
*For a far more comprehensive discussion and analysis on these issues please see The Great Lockdown: Dissecting the Economic Effects, Chapter 2, IMF World Economic Outlook, October 2020.
Viewpoint commentaries are the opinions of the author and do not reflect the views of Haver Analytics.Andrew Cates
AuthorMore in Author Profile »Andy Cates joined Haver Analytics as a Senior Economist in 2020. Andy has more than 25 years of experience forecasting the global economic outlook and in assessing the implications for policy settings and financial markets. He has held various senior positions in London in a number of Investment Banks including as Head of Developed Markets Economics at Nomura and as Chief Eurozone Economist at RBS. These followed a spell of 21 years as Senior International Economist at UBS, 5 of which were spent in Singapore. Prior to his time in financial services Andy was a UK economist at HM Treasury in London holding positions in the domestic forecasting and macroeconomic modelling units. He has a BA in Economics from the University of York and an MSc in Economics and Econometrics from the University of Southampton.


