 Global| Jan 12 2021
Some Reasons To Be Cheerful
by:Andrew Cates
|in:Viewpoints
Summary
Tinges of optimism that had crept into discussions about the global economic outlook toward the end of last year have given way to more balance and even perhaps heightened pessimism in recent weeks. Rapidly rising case numbers in the [...]
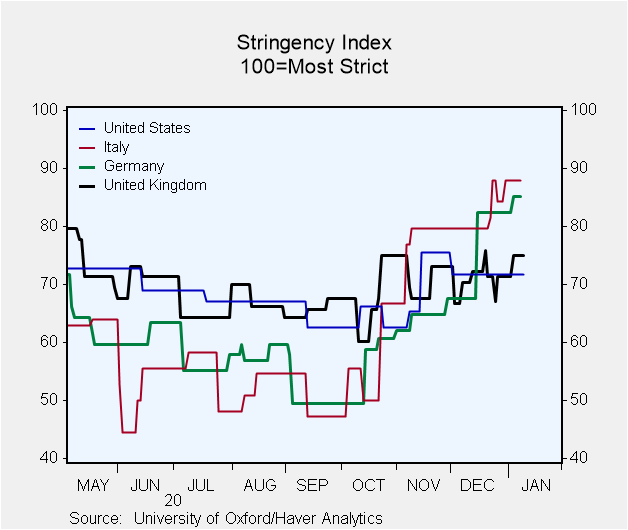
Tinges of optimism that had crept into discussions about the global economic outlook toward the end of last year have given way to more balance and even perhaps heightened pessimism in recent weeks. Rapidly rising case numbers in the Northern Hemisphere and somewhat alarming media reports about the erosion of healthcare capacity in some countries have combined with evidence of new – and more contagious - virus mutations in the UK and South Africa. Against this backdrop lockdown stringency has been tightened in many European countries in recent weeks (see figure 1 below). And since the severity of new restrictions had not been anticipated, some European economists have been revising down their Q1 GDP forecasts for many countries at the same time.
Figure 1: Economic stringency indices in the US, Germany, Italy and the UK
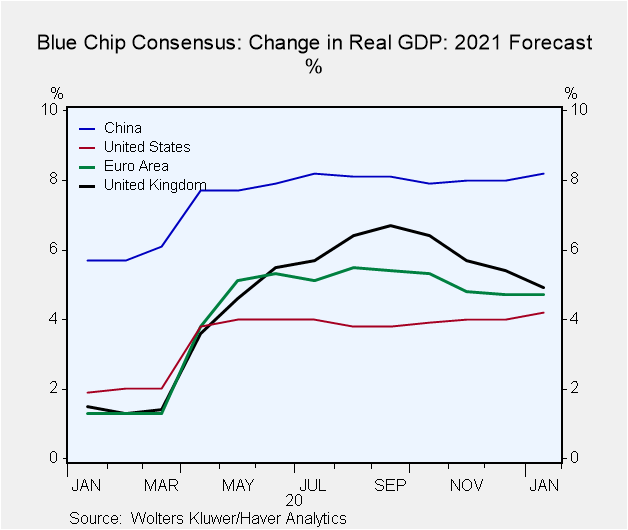
Figure 2: Evolution of Blue Chip GDP consensus for 2021 in the US, China, Euro area and the UK
Should this near-term disruption and likely loss of growth momentum in the immediate weeks ahead derail the more positive messaging about the economic outlook for 2021 as a whole? Our best guess at present is that it should not. Indeed it's notable that while forecasts for GDP growth in Q1 have seen some setback in some countries, the latest January Blue Chip survey reveals little change in consensus forecasts for growth in 2021 as whole. Indeed GDP forecasts for this year for the US and China actually rose a smidgeon in the January survey compared with the December survey. And while UK forecasts admittedly declined, and by a relatively big margin (from 5.4% to 4.9%), euro area growth forecasts were left unchanged (see figure 2 above).
It may be that as the incoming data deteriorates in coming weeks in response to tighter restrictions in some countries, that downgrades will emerge in February. Nevertheless, we think there are many factors that caution against an overtly negative assessment of what lies ahead for the world economy. In what follows we discuss some of these factors with the aid of a few exhibits.
Positive growth momentum toward the end of 2020
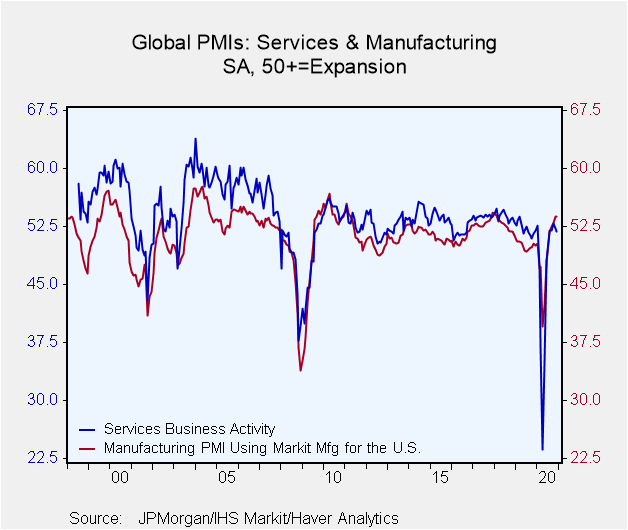
The first factor on our list concerns the relative vigour that's implied by the recent raft of economic survey data. For example, the slew of monthly Purchasing Managers' surveys for December 2020 indicated very little loss of underlying growth momentum in the world economy toward the end of last year. The global composite PMI specifically fell to 51.8 in December from 52.2 in November. Its Q4 average, however, at 53.0, was one point higher than in Q3, and its highest quarterly level since 2018 Q3. And this is despite some tightening of lockdown stringency in many countries and a steep escalation in COVID case numbers toward the end 2020 in many economies.
Figure 3: Global purchasing managers surveys remained in expansion territory in 2020 Q4
Base effects matter
Since these surveys only offer an indication of sequential growth and have little to say about the base from which activity is rising (or falling), it would be churlish to read too much into this data. Many countries have generated some positive economic momentum after all simply because the base from which they are pushing off has been driven to such low levels as a result of the COVID-19 pandemic. Even so, these PMI surveys are still arguably conveying a more positive message about the global economic outlook than one might have imagined based on its behaviour through the course of last year when virus numbers were also rising very sharply.
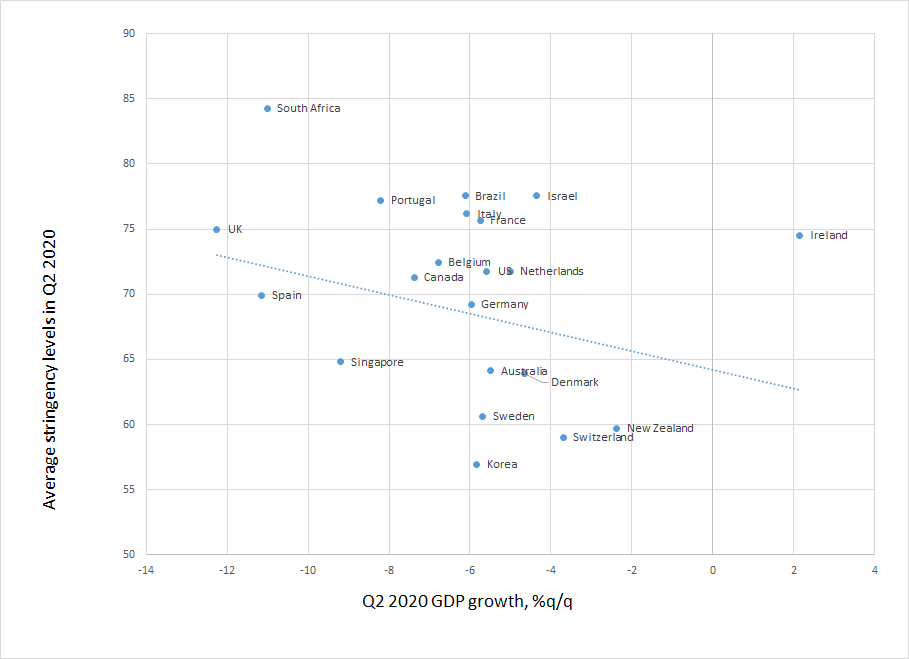
This brings us neatly to the second positive factor on our list, namely that lockdown stringency is losing its potency to affect economic outcomes. In other words the relationship between lockdown stringency and economic growth has broken down. Putting this another way, a pessimistic take on the economic outlook simply because lockdown stringency has tightened does not necessarily follow one for one. In truth – at least at a cross-country level – the relationship between lockdown stringency and economic growth was not that strong to start off with. In figure 4 below we show average levels of the Oxford University economic stringency index (from our ESG database) plotted against the growth rate of GDP in Q2 and Q3 2020 relative to Q1 in a number of major countries. As one would expect tighter lockdown stringency is associated with weaker economic growth. But with a correlation coefficient of just -0.2 there are clearly several additional factors that account for the relative performance of those economies in that period. In fact if we extend this analysis into Q3 and look solely at stringency levels at that time versus economic growth in that period, the correlation coefficient drops close to zero.
Figure 4: Economic stringency levels versus GDP growth in Q2 2020
Source: University of Oxford, Haver Analytics
Stringency versus mobility
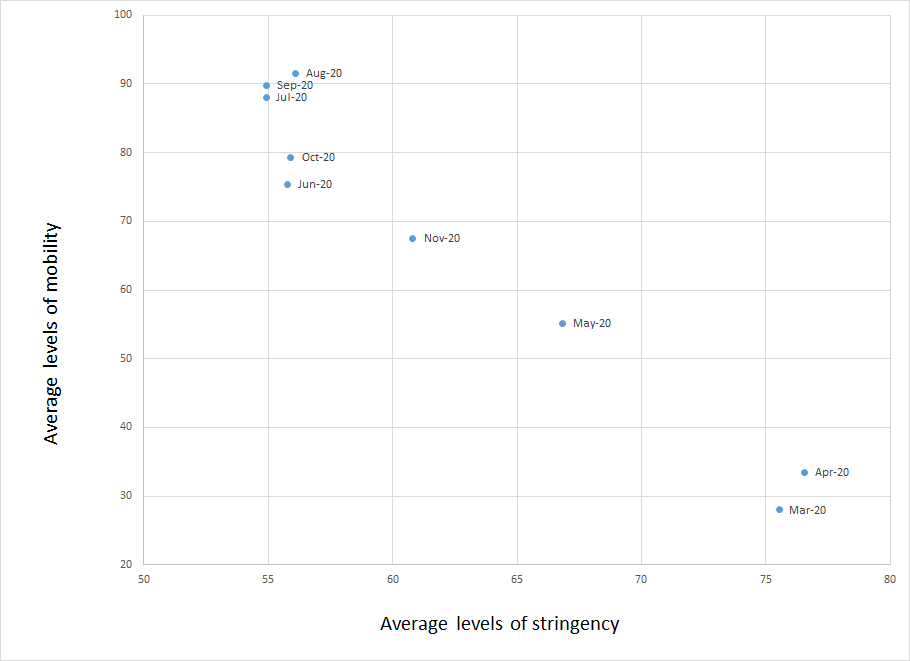
Of course one of the key reasons why there ought, in theory, to have been a relationship between stringency and growth is because higher levels of the former impede mobility. Restrictions on one's ability to travel, to go to work alongside the closure of shops and restaurants (all of which are associated with higher stringency) by definition reduce mobility and curtail economic activity (relative to where they would have been otherwise). But just as the relationship between stringency and growth is quite loose and in fact broke down beyond Q2 2020, so too has the relationship between lockdown stringency and economic mobility. In figure 5 we show that average levels of mobility plotted against average levels of stringency from March through to November last year in a number of major countries. Again in Q2 higher stringency was associated with lower mobility. But beyond Q2 and specifically in July, August, September and October, there was little relationship between the two.
Figure 5: Average stringency levels versus average mobility levels
Source: University of Oxford, Haver Analytics. Sample of countries includes Australia, Canada, France, Germany, Italy, Japan, Spain, the UK, the US, Belgium. Brazil, Denmark, Ireland, Israel, Korea, the Netherlands, New Zealand, Portugal, Singapore, South Africa, Switzerland and Sweden.
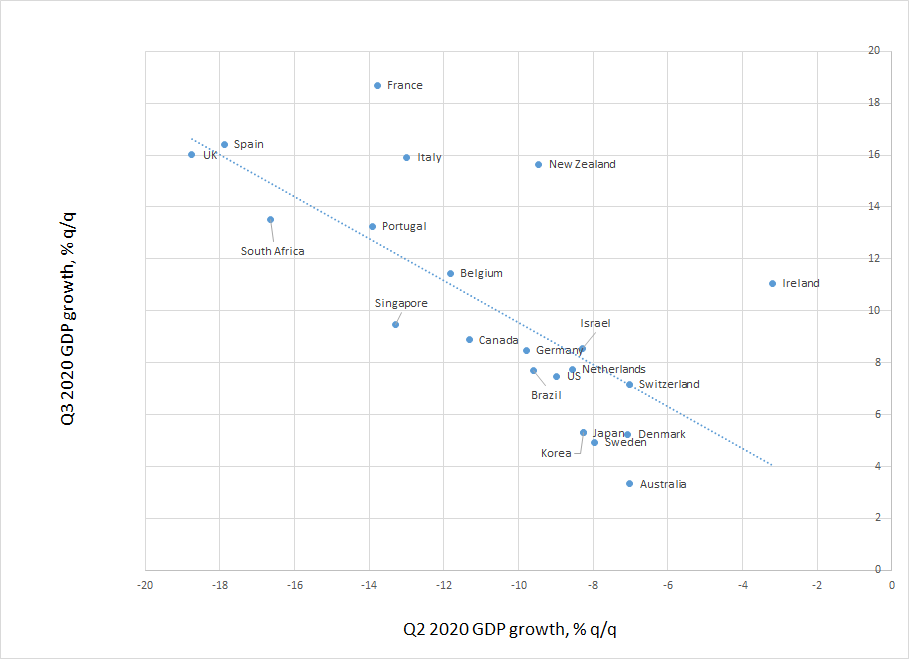
In fact the best predictor of how various economies evolved in Q3 last year concerns the size of the hole that they found themselves in during Q2. We can see this in figure 6 below which shows the relationship between GDP growth in Q2 in a number of countries versus growth in Q3. A weaker performance in Q2 (and thus a bigger hole) relative to other economies seems – on the whole – to have given way to a much stronger relative performance in Q3.
Figure 6: GDP growth in Q2 2020 versus growth in Q3
Source: National sources, Haver Analytics
People have learned to adapt
The reasons for this statistical behaviour are varied and undoubtedly there are some country-specific issues that are of importance not the least of which concerns the respective fiscal and monetary policy response. However, there are some even more straightforward generic reasons for what we can observe in the data. Firstly households and companies have learned to adapt to the virus and have adjusted their behaviour accordingly. So, for example, people are now shopping more online, they are ordering more takeaway food, and they are engaging with others in different ways (e.g. on Zoom). Companies in the meantime are adapting too by changing their business models and re-focusing their activity based on the shifting nature of consumer demand. Of course in many sectors (e.g. airlines, tourism) that is not straightforward and there has been some inevitable impairment of growth and many associated job losses as a consequence. But much of that impairment has already happened. An airline or restaurant can't close down twice for example. The base in other words from which economic growth can now revive is lower than it was (as we saw in figure 6 above). And if events now unfold that additionally suggest the worst will soon be behind us on the virus front there are good grounds for retaining an upbeat cyclical view on what lies ahead for the world economy.
Vaccines to the rescue
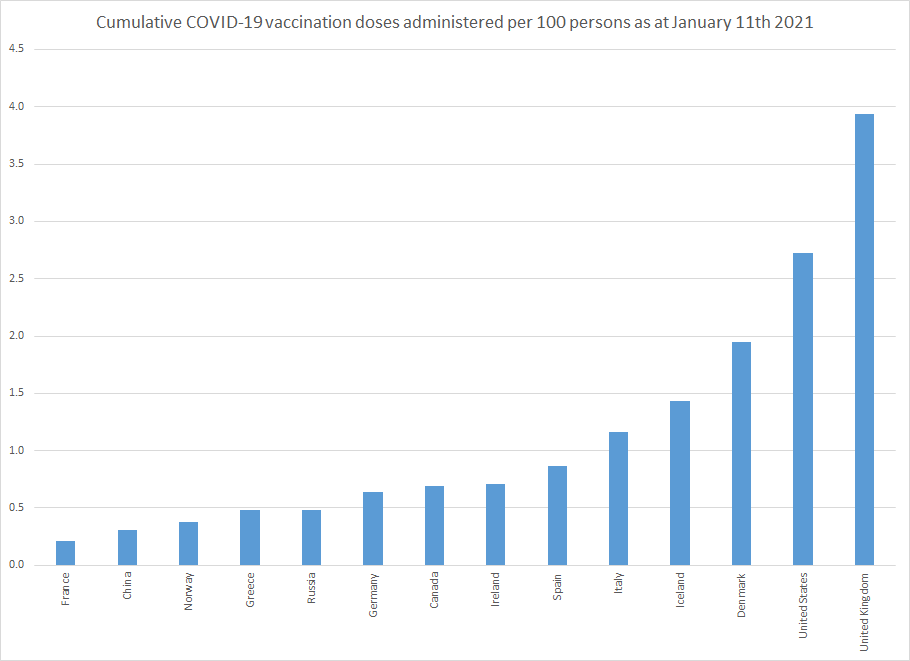
Of course a key reason for thinking the worst of the virus will soon be behind us concerns vaccines. For the record we can now track vaccination dosage data from the University of Oxford (available in our GLSECTOR database) for a number of countries and this is illustrated up to January 11th in figure 7 below. Perhaps, unsurprisingly, countries that have hitherto experienced relatively high case numbers and relatively high mortality rates, such as the US and UK have been at the forefront of a global vaccination effort so far. To the extent that will – with a lag – ease pressure on healthcare capacity and - even more importantly from an economic point of view – reduce fear this is obviously welcome news.
Figure 7: Vaccination doses administered per 100 persons
Source: University of Oxford. Note that Israel's data has not been included in this chart but the latest data reveal a relatively high cumulative vaccination dose of 21.38 per 100 persons as at January 11 2021.
The seasonality of the virus
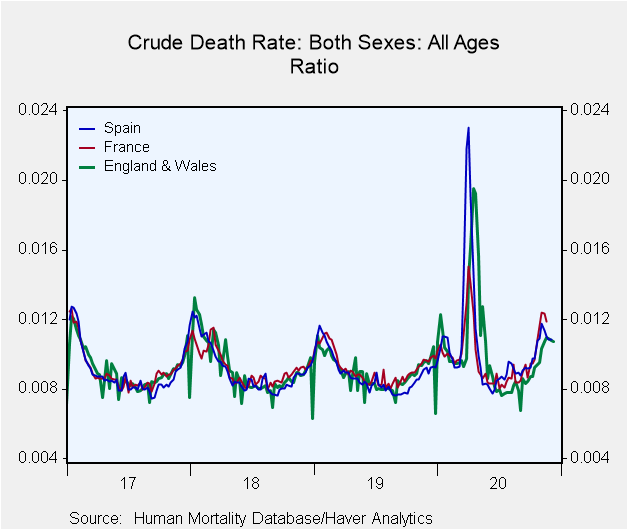
A further reason to retain an optimistic take on global economic matters for 2021 as a whole concerns the seasonality of the virus itself. One of the best data sets that's available to researchers at present to monitor the severity of the COVID pandemic concerns the numbers of “excess” deaths in a country relative to what might be construed as normal. These data, from the Human Mortality Database (and also available in our GLSECTOR database), are shown in Figure 8 below for England and Wales and for Spain and France. The big spike in these data in Q2 2020 in these countries was obviously mostly triggered by the fatalities generated by the COVID pandemic. But the other notable feature of this data is its seasonality. Death rates climb during the autumn and winter months and fade during the spring and summer months partly because of the escalation in flu-like viruses that take hold in colder temperatures. At the time of writing the data that are available from this source only run to early December and will almost certainly climb sharply in coming weeks. But the figure below also suggests – if previous seasonal patterns repeat themselves – that there ought to be a natural fade of case numbers and fatality rates as the Northern Hemisphere emerges from winter into spring.
Figure 8: Crude death rates for England & Wales, France and Spain
Policy positives
Other factors that are worthy of mention but which are nevertheless well-rehearsed for those with a positive take on global economic matters concern policy settings. For the record though in recent weeks European leaders have finally reached some agreement on a EUR 750 billion recovery fund. Further fiscal policy initiatives have also been forthcoming in the US the most notable of which was a coronavirus relief and government funding bill worth around USD 877 billion (4.5% of GDP). A further supplementary budget from Japan was also announced in early December worth around JPY 73.6 trillion (13.1% of GDP).
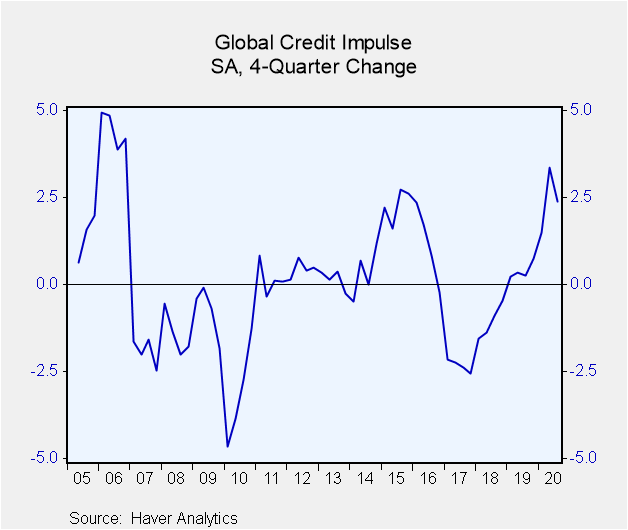
These policy positives are surely one reason why global equity markets have begun the New Year with a tailwind behind them. The overall support from monetary policy and the degree to which this has – hitherto – moved the wheels of credit are surely a contributing factor to this too (see figure 9 below). Indeed the ECB's decision to extend the duration and scale of several monetary policy instruments toward the end of last year including via a EUR 500 increase in its Pandemic Emergency Purchase Program is a notable development.
Figure 9: Haver's global credit impulse
There are still some downside risks
There are undeniably some downside risks. Labour market stress is deeply concerning and in particular the scarring that's being generated by higher levels of long-term unemployment. Debt-related issues in some emerging market countries are another cause for concern not least given the absence of a sustainable motor for export income generation in recent times. It's possible too – albeit unlikely in our view – that inflation levels will meaningfully break out to the upside in the coming months, pressuring Central Banks to withdraw monetary accommodation in ways that ignite financial instability.
Upside risks beyond Q1
Weighing up these negatives however against the positives that we discussed above still suggests to us that beyond Q1 the economic outlook in the months ahead carries upside risk. Lockdown stringency matters but not as much as it used to. Vaccines are now firing up and while it may still take several weeks/months before herd immunity is reached in many major countries, underlying fear about COVID-19 ought to dissipate. The onset of spring in the Northern Hemisphere should assist in that effort. And in the meantime policy support should remain extraordinarily strong.
Viewpoint commentaries are the opinions of the author and do not reflect the views of Haver Analytics.Andrew Cates
AuthorMore in Author Profile »Andy Cates joined Haver Analytics as a Senior Economist in 2020. Andy has more than 25 years of experience forecasting the global economic outlook and in assessing the implications for policy settings and financial markets. He has held various senior positions in London in a number of Investment Banks including as Head of Developed Markets Economics at Nomura and as Chief Eurozone Economist at RBS. These followed a spell of 21 years as Senior International Economist at UBS, 5 of which were spent in Singapore. Prior to his time in financial services Andy was a UK economist at HM Treasury in London holding positions in the domestic forecasting and macroeconomic modelling units. He has a BA in Economics from the University of York and an MSc in Economics and Econometrics from the University of Southampton.


