 Global| Sep 25 2020
Two Steps Forward, One Step Back
by:Andrew Cates
|in:Viewpoints
Summary
The last few days have seen mounting evidence that firmly quashes the idea that we might have been close to achieving any semblance of normality in the period immediately ahead. The latest data that concern COVID-19 in particular make [...]
The last few days have seen mounting evidence that firmly quashes the idea that we might have been close to achieving any semblance of normality in the period immediately ahead. The latest data that concern COVID-19 in particular make for grim reading. Global case numbers are on the rise again and most notably in many European countries that had already experienced a difficult first wave earlier this year. Policymakers in the region are understandably taking note of this and often instigating slightly more stringent measures concerning lockdowns and social distancing. And that will - by definition - curtail economic activity as we head into Q4. This comes at a time moreover when many economic forecasters and financial market participants had arguably assumed a somewhat rosier scenario. It may be no surprise therefore that some of the incoming high profile economic data (such as this week's flash purchasing managers' surveys for September) have rolled over in Europe and disappointed economists' expectations. It may be no surprise either against this backdrop that a rally in global equity markets in recent weeks has – for the time being at least – stalled.
In what follows we look at some of these observations in more detail with respect to some of the key underlying data.
Figure 1: Europe's cases numbers are on the rise
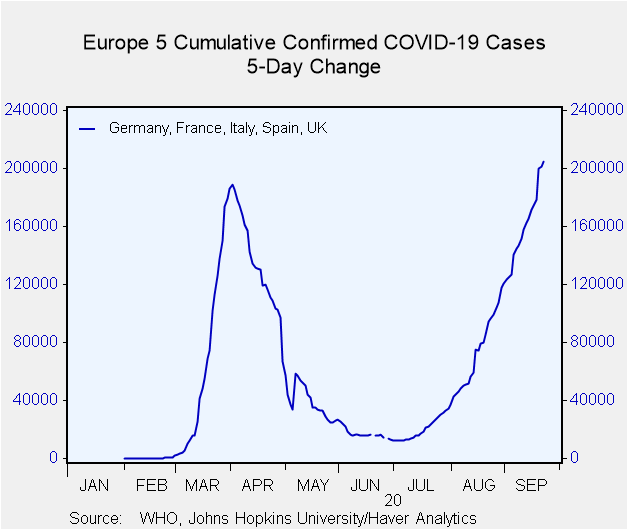 Firstly on the virus itself the latest data show that global daily incidence levels are increasing. That's been driven largely by increasing case numbers in India as well as in multiple countries in Europe, both West and East. Indeed as we illustrate in Figure 1 incidence in Europe's five largest economies has now exceeded the first peak in March.
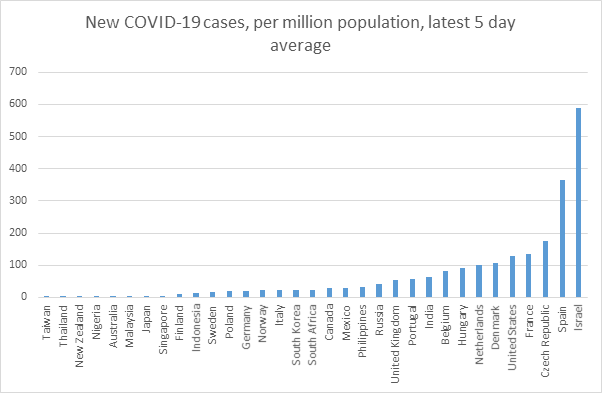
As we illustrate in Figure 2 below moreover there are many other major countries where new case numbers (per million of the population) have been high and rising in recent weeks including, for example, in the US, Canada and Israel. This stands in contrast with the likes of Australia, New Zealand and Japan where case numbers have been in retreat following several weeks of rising numbers.
Figure 2: Latest case numbers per head
Source: Oxford University, Haver Analytics
As is now well known international comparisons of this kind are often fraught with problems. The data presented in Figure 2 above, for example, show only the number of positive cases that were confirmed by a laboratory test. This takes no consideration therefore of how ubiquitous testing might be in any particular country. And that in turn is one reason why a whole ream of additional data are also collected by health organisations that look at other factors including, for example, the positive rate - the share of tests that yield a positive result. A high positive rate could imply that countries are not testing widely enough to find all positive cases as many of those cases could be going unreported. Data for this metric incidentally is now collected and published by the UK's Oxford University as part of its Our World In Data project and stored in Haver's Global Sector (GLSECTOR) database.
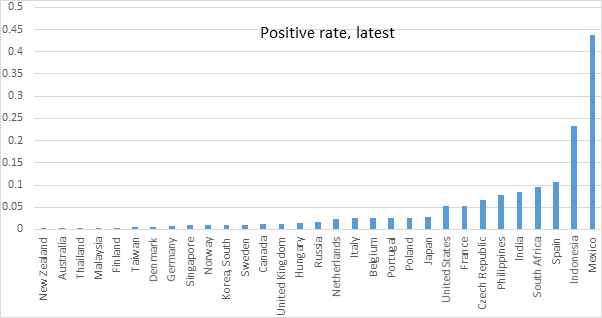
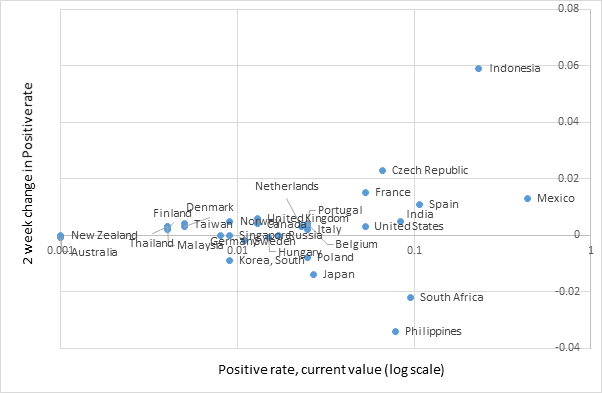
In Figures 3 and 4 below we provide some colour on this with lllustrations of the latest data for the positive rate as well as how this has changed over the last two weeks. On the whole this places some countries in the Asian time zone as well as the likes of Australia and New Zealand in a relatively favourable light. But in contrast, highly populous countries in Asia such as India, Indonesia and the Philippines together with Mexico, Spain and South Africa are placed in a much less favourable light.
Figure 3: The Positive Rate Figure 4: Positive rate, latest data and two week changes
Source: Oxford University, Haver Analytics Source: Oxford University, Haver Analytics
Figure 5: Global cases and deaths
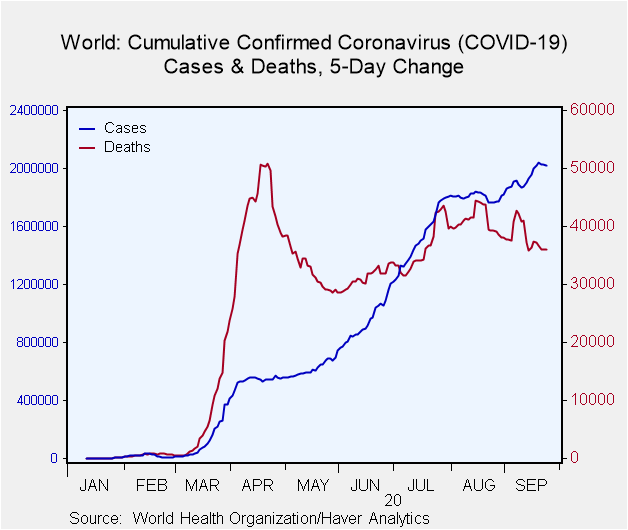 At the broad global level though it seems too soon to conclude that as far as the virus and its impact are concerned the worst is over. Global case numbers on the whole are on the rise and while the trend is certainly slowing there has not been that much let up in death statistics either (see Figure 5). Large highly populous countries in the meantime - including the United States - are still generating high case numbers and relatively high positive results from their testing numbers as we discussed above.
It almost goes without saying then that policymakers will be somewhat reluctant to lighten up any further on the policies that have been enacted in recent months to contain the virus. It seems far more likely in fact, at least in some countries, that policy measures will become more stringent. And this clearly matters for the likely evolution of those economies.
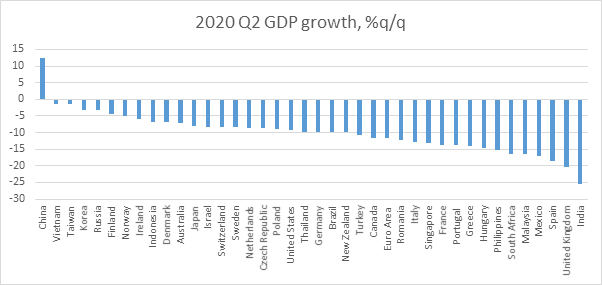
On that economic front we already know that global activity was crushed in the second quarter of this year partly because of the stringency of lockdown measures including the enforcement of social distancing policies and the closure of key sectors. In Figure 6 below we show the scale of the economic decline across 40 countries for which the latest GDP data are available. With the notable exception of China every country on our list experienced an economic retreat. China is an outlier in experiencing an economic advance simply because the worst of the virus and lockdown policies had unfolded in Q1 and the unwinding of these policies allowed a recovery to unfold in Q2.
Figure 6: The scale of economic decline in Q2 2020
Source: National sources, Haver Analytics
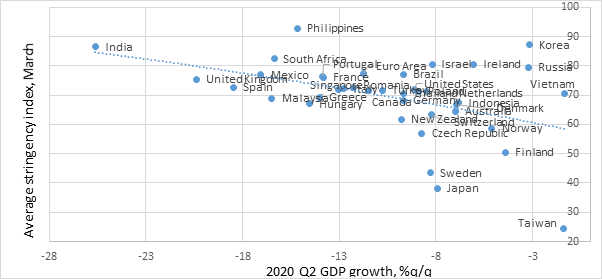
The more stringent the lockdown measures however the harder the economy has typically been hit. We can see this via Figure 7 below in which we compare the scale of the economic decline in Q2 versus an index of stringency (from March through to June 2020) that's calculated by Oxford University. The higher the index the more stringent the policies that have been enacted toward things like school closures, restrictions on travel, social gatherings, businesses, and public events.
Figure 7: Relative economic performance in Q2 is linked to the stringency of lockdown measures
Source: Oxford University, Haver Analytics
There are of course other important factors that can account for the scale of the retreat in GDP in that quarter including the timing of any COVID escalation, the weight and exposure of various sectors in the economy to generic lockdown restrictions as well as the size and nature of the economic policy response. Still, the overall stringency of lockdown policies appears to have mattered. And that's important for how policymakers now respond to a second wave and by extension how economies subsequently behave.
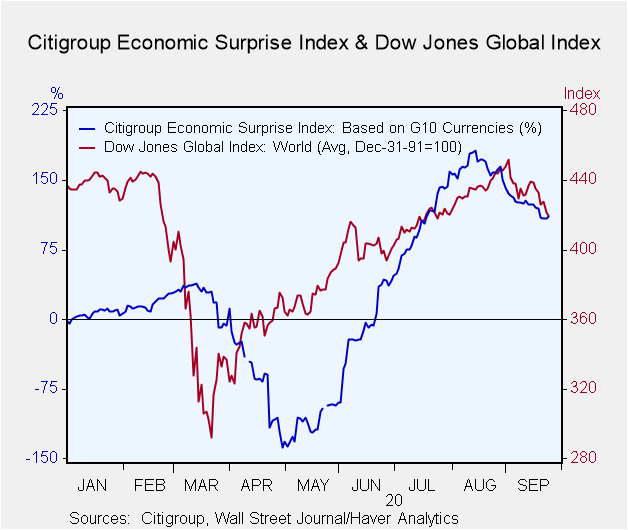
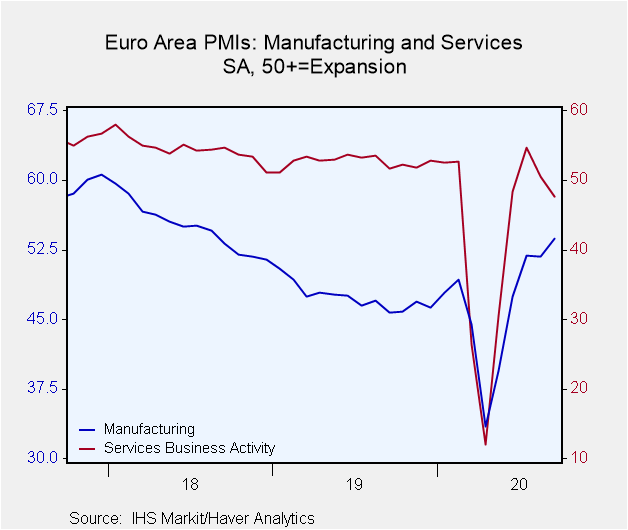
This matters too though relative to expectations. As we argued in a previous commentary (see Hard Times and Great Expectations) expectations for how the world economy will evolve in the coming period have arguably been quite high relative to its likely performance. It's noteworthy therefore that incoming economic data have begun to surprise expectations on the downside more frequently in recent days. It's noteworthy too that high profile data points such as September's flash Purchasing surveys for Europe have rolled over by more than economists' had anticipated. And it's even more noteworthy in the details of those surveys that the services PMI in the euro area moved back into contraction territory. Against that backdrop perhaps it's hardly a surprise that the rally in global equity markets in recent weeks has stalled in the past few days (see Figures 8 and 9 below).
Figure 8: Economic surprises versus global equity markets Figure 9: Flash PMI surveys in Euro Area
Andrew Cates
AuthorMore in Author Profile »Andy Cates joined Haver Analytics as a Senior Economist in 2020. Andy has more than 25 years of experience forecasting the global economic outlook and in assessing the implications for policy settings and financial markets. He has held various senior positions in London in a number of Investment Banks including as Head of Developed Markets Economics at Nomura and as Chief Eurozone Economist at RBS. These followed a spell of 21 years as Senior International Economist at UBS, 5 of which were spent in Singapore. Prior to his time in financial services Andy was a UK economist at HM Treasury in London holding positions in the domestic forecasting and macroeconomic modelling units. He has a BA in Economics from the University of York and an MSc in Economics and Econometrics from the University of Southampton.


