How Did We Get to this Point on Trade?
The US current account deficit has nearly tripled over the past eight years, covering the previous two administrations. With the current account deficit now running at roughly $1.1 trillion per year or 3.7 percent of GDP, the new administration has announced across-the-board increases in tariffs in order to level the playing field on trade. We wondered how we got here and if the causes might highlight ways to solve the problem.
In the April 3 Viewpoints article titled Liberating the Downside, Andy Cates and Kevin Gaynor discussed the prospects for narrowing the US current account deficit through tariffs in the context of the national accounts. One way to look at the national accounts is though the following identity
(M – X) = (I – S) + (G – T)
where (M – X) is the current account deficit, (I – S) is the private borrowing need, and (G – T) is the public borrowing need or the government budget deficit. This equation offers a valuable framework to identify the underlying causes of the undesirable rise in the US current account deficit.
Based on a combination of Bureau of Economic Analysis NIPA Tables 3.1, 4.1 and 5.1 (all these data can be found in the Haver USNA database), it is clear that the interplay between saving and investment drives the current account, with some small adjustments for the statistical discrepancy.
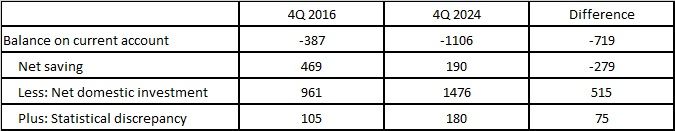
These data show that the main driver of the widening current account deficit over the past eight years was the growing shortage of saving in the US relative to the amount of investment. Over the past eight years, net domestic investment increased at a healthy 5.5 percent annual rate, or by $515 billion, but net saving declined at a 10.7 percent annual rate, or by $279 billion.
As a result, the US needed to borrow the money from somewhere else - that money had to come from abroad. For example, US importers convert dollars to yuan to buy products from China. Now China has dollars. Since China does not use dollars as currency in China, the dollars are lent back to the US (China buys US Treasury securities), which helps satisfy the public borrowing need.
To see what is really going on, we broke down net saving further into public and private saving.

Private saving increased at a healthy pace, rising at a 5.4 percent annual rate, or by $733 billion, over the eight years. In fact, the rise in private saving more than offset the $515 billion rise in investment, suggesting that the private sector borrowing need actually declined and took pressure off the current account.
Meanwhile, the net government borrowing need (the budget deficit) skyrocketed. The budget deficit, which was already in deep negative territory eight years ago, declined sharply further during the following two administrations – by another trillion dollars. In other words, the expanding government budget deficit has driven the widening of the current account deficit.
These tables suggest that tariffs cannot fix this problem. The US current account deficit is a function of the excessive borrowing needs within the US, in particular the government budget deficit. The most effective way to reduce the current account deficit and limit reliance on borrowing from abroad is to bring US government finances under control.

Peter D'Antonio
AuthorMore in Author Profile »Peter started working for Haver Analytics in 2016. He worked for nearly 30 years as an Economist on Wall Street, most recently as the Head of US Economic Forecasting at Citigroup, where he advised the trading and sales businesses in the Capital Markets. He built an extensive Excel system, which he used to forecast all major high-frequency statistics and a longer-term macroeconomic outlook. Peter also advised key clients, including hedge funds, pension funds, asset managers, Fortune 500 corporations, governments, and central banks, on US economic developments and markets. He wrote over 1,000 articles for Citigroup publications. In recent years, Peter shifted his career focus to teaching. He teaches Economics and Business at the Molloy College School of Business in Rockville Centre, NY. He developed Molloy’s Economics Major and Minor and created many of the courses. Peter has written numerous peer-reviewed journal articles that focus on the accuracy and interpretation of economic data. He has also taught at the NYU Stern School of Business. Peter was awarded the New York Forecasters Club Forecast Prize for most accurate economic forecast in 2007, 2018, and 2020. Peter D’Antonio earned his BA in Economics from Princeton University and his MA and PhD from the University of Pennsylvania, where he specialized in Macroeconomics and Finance.

Shashwat Indeevar
AuthorMore in Author Profile »Shashwat Indeevar is a Senior Economic Data Manager at Haver Analytics, where he has been part of the Research Team since 2017, working in both the New York and London offices. He focuses on the organization and presentation of large-scale datasets, the improvement of database-building processes, and the management of daily workflow. His economic research interests include global energy use, environmental sustainability, and artificial intelligence.
He holds a Master of Science in Management of Technology from New York University, where he studied finance, economics, and operations management. He also earned a Bachelor of Engineering in Electronics and Communications from Panjab University, India.
 Global