 Global| Aug 09 2007
2006 Housing Stock Has Smallest Gain in 11 Years, But Housing Stock per Household Continues To Grow
Summary
Yesterday the Bureau of Economic Analysis of the Commerce Department released the annual revision of the capital stock data, known more formally as "Fixed Assets and Consumer Durable Goods". There is new data for year-end 2006 and [...]

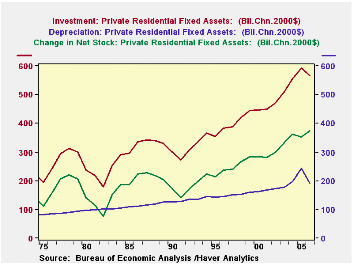
Yesterday the Bureau of Economic Analysis of the Commerce Department released the annual revision of the capital stock data, known more formally as "Fixed Assets and Consumer Durable Goods". There is new data for year-end 2006 and revision of 2004 and 2005. All these series, at current, historical and real costs, plus associated data on investment and depreciation are contained in Haver's CAPSTOCK database. It is roughly the case that for any item in real terms, that is, chained 2000 dollars, the change in the capital stock each year equals investment minus depreciation.
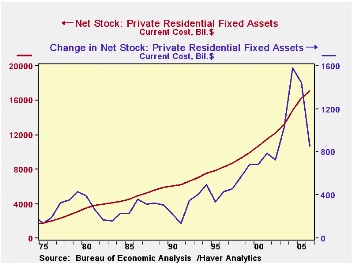
We select here for highlight a single line-item, Private Residential Fixed Assets. This measure of the housing stock on a current cost basis expanded just 5.3% in 2006, less than half the pace of the two prior years and the smallest annual increase since 1995. In recent years, the largest increase was 11.9% in 2004. Historically, the largest single increase in this 82-year-long dataset was in 1946, the first year after World War II, when it increased more than 23%. In the late 1970s as the Baby Boomer generation were forming their own households and having their children, the housing stock expanded at an average annual rate just over 16%. These figures are all in current cost terms
In the last few years, we've come to talk informally about "McMansions": the building of enormous houses in great quantity that makes them seem somewhat mass produced. In some cases, homebuyers have bought an existing house and had it demolished to build their new home in some desired location where no vacant property is readily available. In looking at these capital stock data, we think we see some evidence of this in the substantial increases in the real values of both investment and depreciation in 2004 and 2005. Investment increased by 18% in 2004 and nearly 14% in 2005; last year, investment decreased 0.4%. Depreciation barreled ahead 11% and 24% in those years, respectively; it then dropped off last year by 21%. The long history of these data show how much out of line the recent developments in homebuilding are with more traditional patterns.
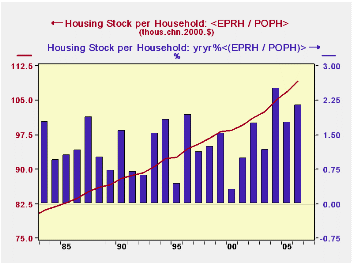
Basic demand for housing of course has its origin in household formation. Is this responsible for the recent huge increases in the housing stock? Actually only a little. The growth in the number of households has actually been quite modest: the Census Bureau's annual count shows an increase of 1.3% annually from 2000 to 2004, when the real housing stock rose 2.9%. In 2005, households increased 1.2% and the housing stock, 3.0%. In 2006, the comparison was 0.9% households and 3.0% real stock. Thus, the amount of house per household is increasing. In the last graph here, we see it up 2.1% last year, reaching $109,000 in chained 2000 prices; since 2000, this has gained at a 1.7% annual pace. Bigger houses seem still to be the vogue.
| Housing Stock, Year-End, Bil.$ | 2006 | 2005 | 2004 | 2003* | 2000* | 1995* |
|---|---|---|---|---|---|---|
| Total @ Current Cost | 17,103.5 | 16,245.3 | 14,802.5 | 13,224.7 | 10,675.7 | 7,839.8 |
| % Change | 5.3% | 9.7% | 11.9% | 7.4% | 6.4% | 5.1% |
| Total @ Real Cost | 12,488.9 | 12,115.4 | 11,763.3 | 11,401.4 | 10,487.8 | 9,174.2 |
| % Change | 3.1% | 3.0% | 3.2% | 2.8% | 2.7% | 2.2% |
| Dollar Change | 373.5 | 352.1 | 361.9 | 304.5 | 262.7 | 190.2 |
| Real Investment | 565.1 | 593.5 | 556.7 | 476.2 | 416.4 | 327.6 |
| Real Depreciation | 256.9 | 310.4 | 234.7 | 184.8 | 144.0 | 111.0 |
by Robert Brusca August 9, 2007

The UK trade balance has remained fairly stable through all this volatility.
The shorter growth horizons show that export growth has started to pick up at a fast pace than import growth. Yr/Yr exports are off a bit more than imports, but over the past 3-6 months they are up at a much faster pace and accelerating. Export growth is stronger across road vehicles, basic materials and firmer for capital goods. For food, beverages and tobacco, flows are still weak and dropping.
For imports, basic materials are strong and so are road vehicles, but vehicle imports have slowed somewhat. Food, beverages and tobacco imports are steady. Capital goods imports have slowed their decline. Overall imports are lower over three months at a 1% pace and up over six months by just 1.8%.
The slowing in imports has allowed the strength in exports to bolster the trade position in general. In June the deficit improved slightly to -£6.27bln compared to -£6.44bln in May.
| m/m% | % Saar | ||||
| Jun-07 | May-07 | 3M | 6M | 12M | |
| Balance* | -££ 6.27 | -££ 6.44 | -££ 6.61 | -££ 6.78 | -££ 6.72 |
| Exports | |||||
| All Exports | 4.9% | 4.6% | 19.3% | 10.6% | -13.3% |
| Capital goods | 3.2% | 4.3% | 3.3% | -21.0% | -52.0% |
| Road Vehicles | 5.3% | 0.2% | 32.8% | 17.1% | 6.2% |
| Basic Materials | -1.4% | 5.7% | 67.9% | 41.0% | 15.4% |
| Food Beverages & Tobacco | -9.1% | 9.5% | -21.0% | -4.4% | -0.8% |
| IMPORTS | |||||
| All Imports | 2.9% | 0.5% | -1.0% | 1.8% | -11.9% |
| Capital goods | 4.0% | -1.7% | -9.7% | -26.3% | -52.7% |
| Road Vehicles | 3.7% | 6.9% | 18.8% | 36.6% | 12.3% |
| Basic Materials | 1.2% | 2.7% | 46.3% | 15.3% | 22.7% |
| Food Beverages & Tobacco | -1.5% | -0.4% | 4.4% | 3.0% | 4.9% |
| *Stg Blns; mo or period average | |||||
by Tom Moeller August 9, 2007


Initial claims for unemployment insurance rose again last week, to 316,000. The 7,000 w/w increase followed a 6,000 rise during the prior week that was revised up slightly. Consensus expectations had been for 310,000 claims in the latest period.
A claims level below 400,000 typically has been associated with growth in nonfarm payrolls. During the last ten years there has been a (negative) 78% correlation between the level of initial claims and the m/m change in nonfarm payroll employment.
The four-week moving average of initial claims rose slightly to 307,750 (-1.2% y/y).
Continuing claims for unemployment insurance rose 39,000 after a revised 21,000 decline during the prior week. The continuing claims numbers lag the initial claims figures by one week.
The insured rate of unemployment remained at 1.9%.
| Unemployment Insurance (000s) | 08/04/07 | 07/28/07 | Y/Y | 2006 | 2005 | 2004 |
|---|---|---|---|---|---|---|
| Initial Claims | 316 | 309 | -0.9% | 313 | 331 | 343 |
| Continuing Claims | -- | 2,52559 | 3.7% | 2,545 | 3.3% | 2,459 |
Carol Stone, CBE
AuthorMore in Author Profile »Carol Stone, CBE came to Haver Analytics in 2003 following more than 35 years as a financial market economist at major Wall Street financial institutions, most especially Merrill Lynch and Nomura Securities. She had broad experience in analysis and forecasting of flow-of-funds accounts, the federal budget and Federal Reserve operations. At Nomura Securities, among other duties, she developed various indicator forecasting tools and edited a daily global publication produced in London and New York for readers in Tokyo. At Haver Analytics, Carol was a member of the Research Department, aiding database managers with research and documentation efforts, as well as posting commentary on select economic reports. In addition, she conducted Ways-of-the-World, a blog on economic issues for an Episcopal-Church-affiliated website, The Geranium Farm. During her career, Carol served as an officer of the Money Marketeers and the Downtown Economists Club. She had a PhD from NYU's Stern School of Business. She lived in Brooklyn, New York, and had a weekend home on Long Island.
More Economy in Brief
 Global| Feb 05 2026
Charts of the Week: Balanced Policy, Resilient Data and AI Narratives
by:Andrew Cates


