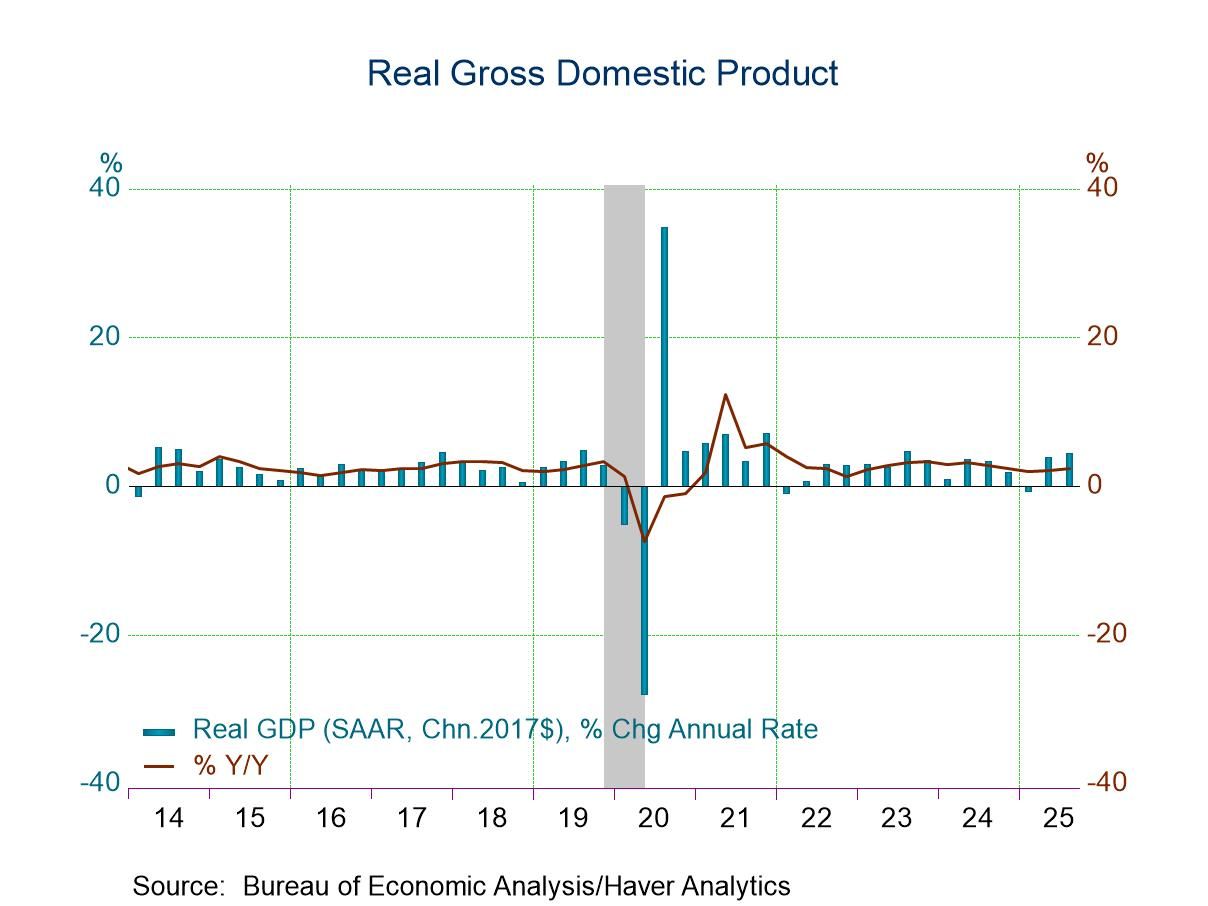
- Consumer spending strengthens; growth in business investment decelerates.
- Corporate profit growth led by earnings abroad.
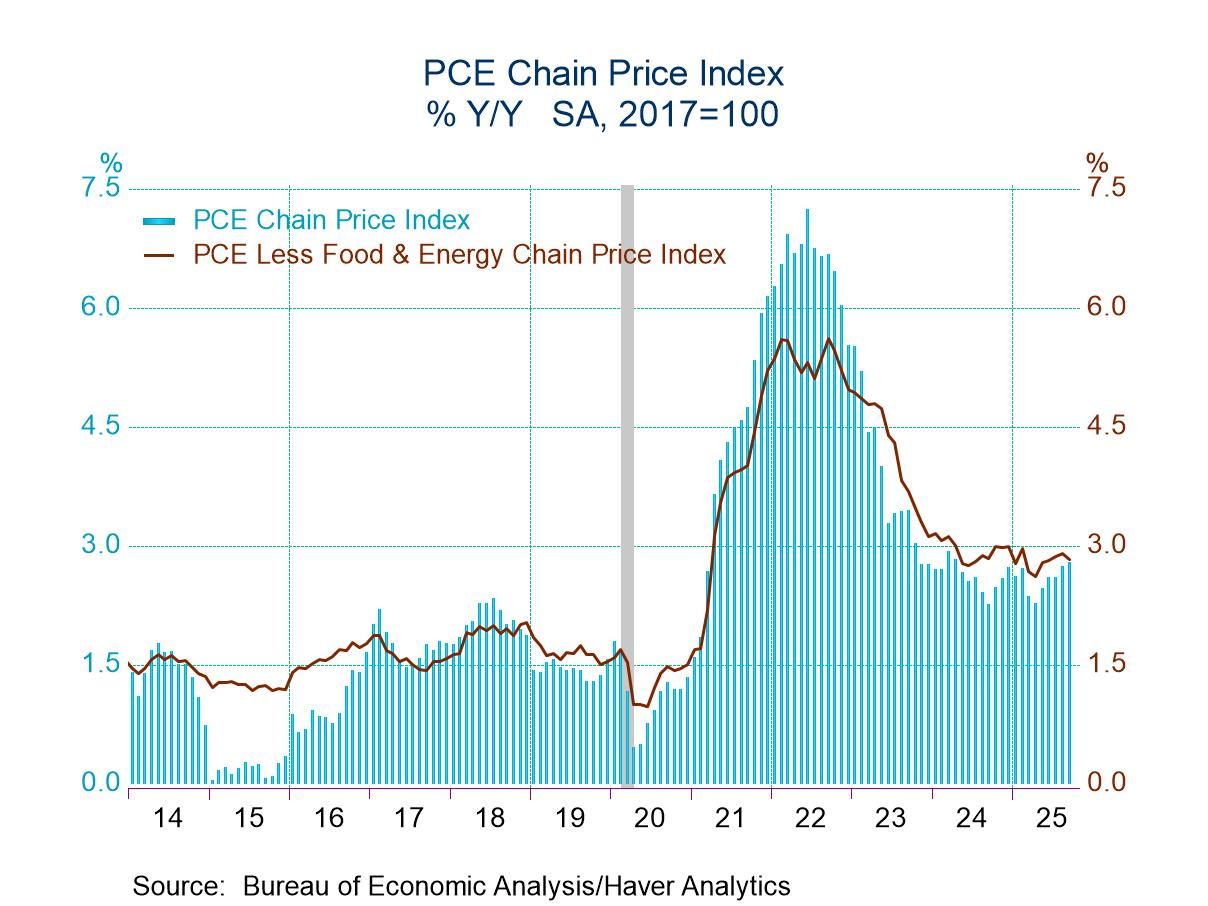
- Rise in chain price index accelerates.
Introducing
Tom Moeller
in:Our Authors
Prior to joining Haver Analytics in 2000, Mr. Moeller worked as the Economist at Chancellor Capital Management from 1985 to 1999. There, he developed comprehensive economic forecasts and interpreted economic data for equity and fixed income portfolio managers. Also at Chancellor, Mr. Moeller worked as an equity analyst and was responsible for researching and rating companies in the economically sensitive automobile and housing industries for investment in Chancellor’s equity portfolio. Prior to joining Chancellor, Mr. Moeller was an Economist at Citibank from 1979 to 1984. He also analyzed pricing behavior in the metals industry for the Council on Wage and Price Stability in Washington, D.C. In 1999, Mr. Moeller received the award for most accurate forecast from the Forecasters' Club of New York. From 1990 to 1992 he was President of the New York Association for Business Economists. Mr. Moeller earned an M.B.A. in Finance from Fordham University, where he graduated in 1987. He holds a Bachelor of Arts in Economics from George Washington University.

Publications by Tom Moeller
 USA| Dec 23 2025
U.S. GDP Growth is Strong in Q3; Profits Jump
by:Tom Moeller
|in:Economy in Brief
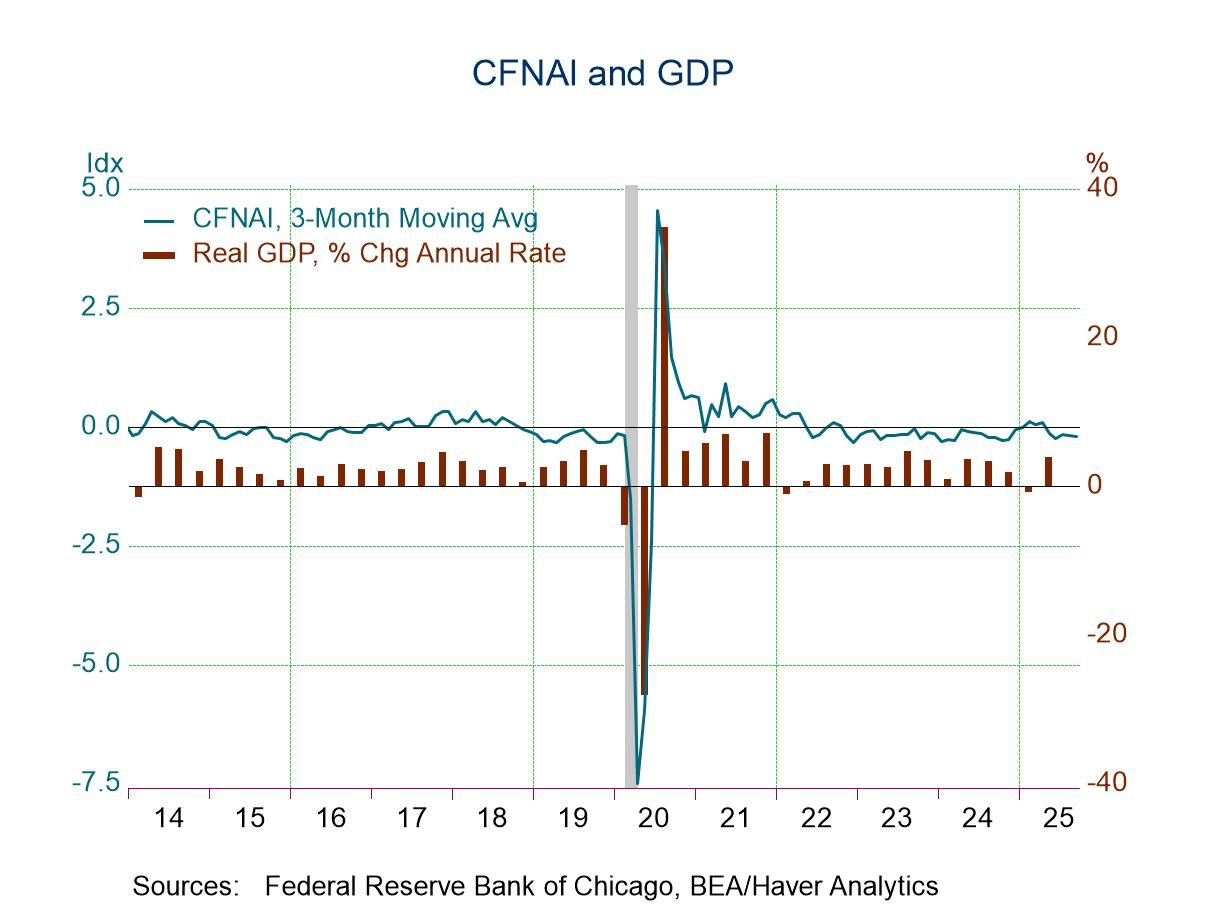
- The CFNAI is negative for sixth straight month.
- Three of four index components remain negative
- Improvement in labor market reading leads m/m gain.
The Federal Reserve Bank of Chicago indicated that the December 22, 2025, release of the CFNAI was originally scheduled to cover data through November 2025. However, because of the delay in data releases from government statistical agencies due to the federal government shutdown, this CFNAI release will instead only cover data through September 2025.
by:Tom Moeller
|in:Economy in Brief
 USA| Dec 19 2025
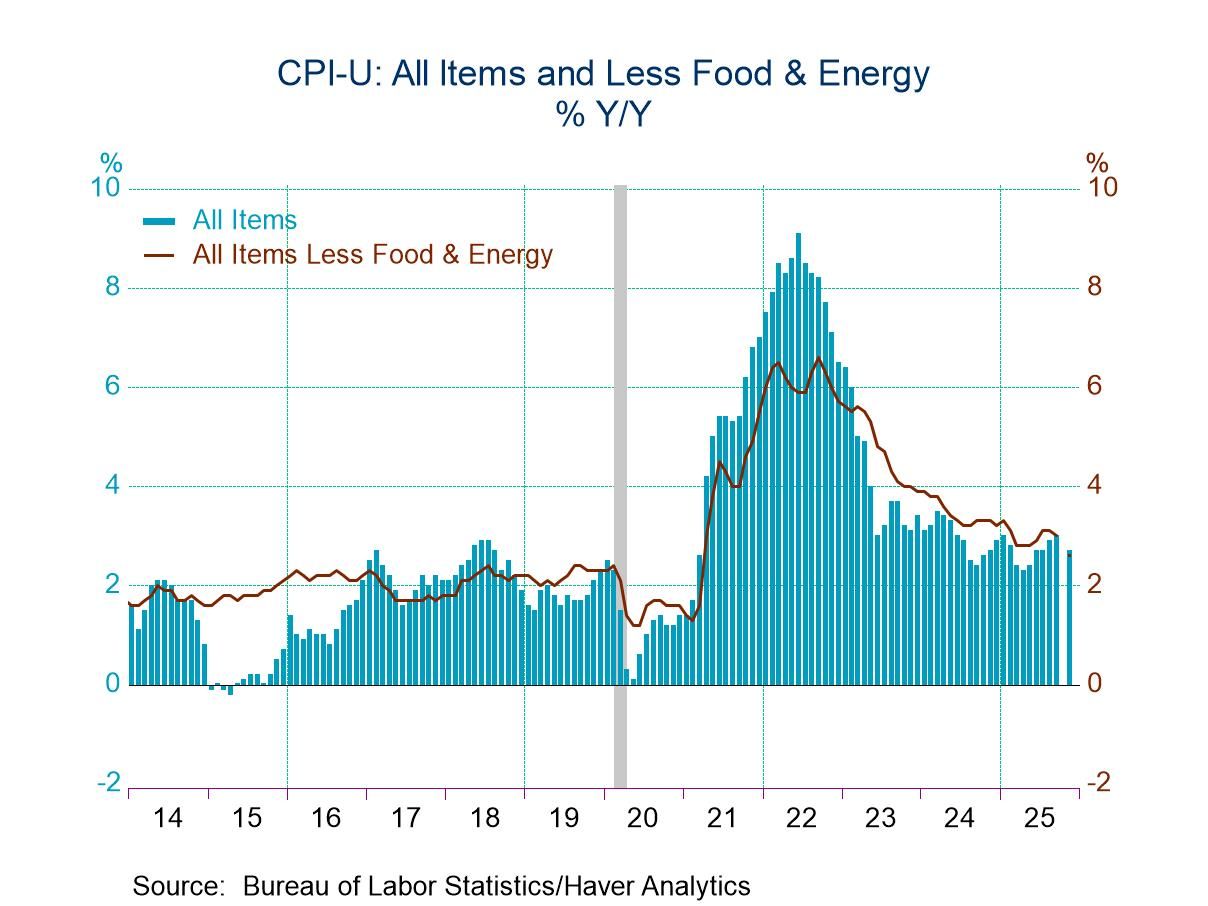
U.S. Consumer Price Inflation Moderates in November
- Year-to-year comparison is slowest in four months.
- Core price gain exhibits weakest y/y increase since 2021.
- Services price inflation tumbles y/y; core goods price gain is stable.
by:Tom Moeller
|in:Economy in Brief
 USA| Dec 12 2025
U.S. Housing Affordability Edges Higher in October
- Mortgage rates continue to decline.
- Median income strengthens.
- Affordability improves in most of country.
by:Tom Moeller
|in:Economy in Brief
 USA| Dec 11 2025
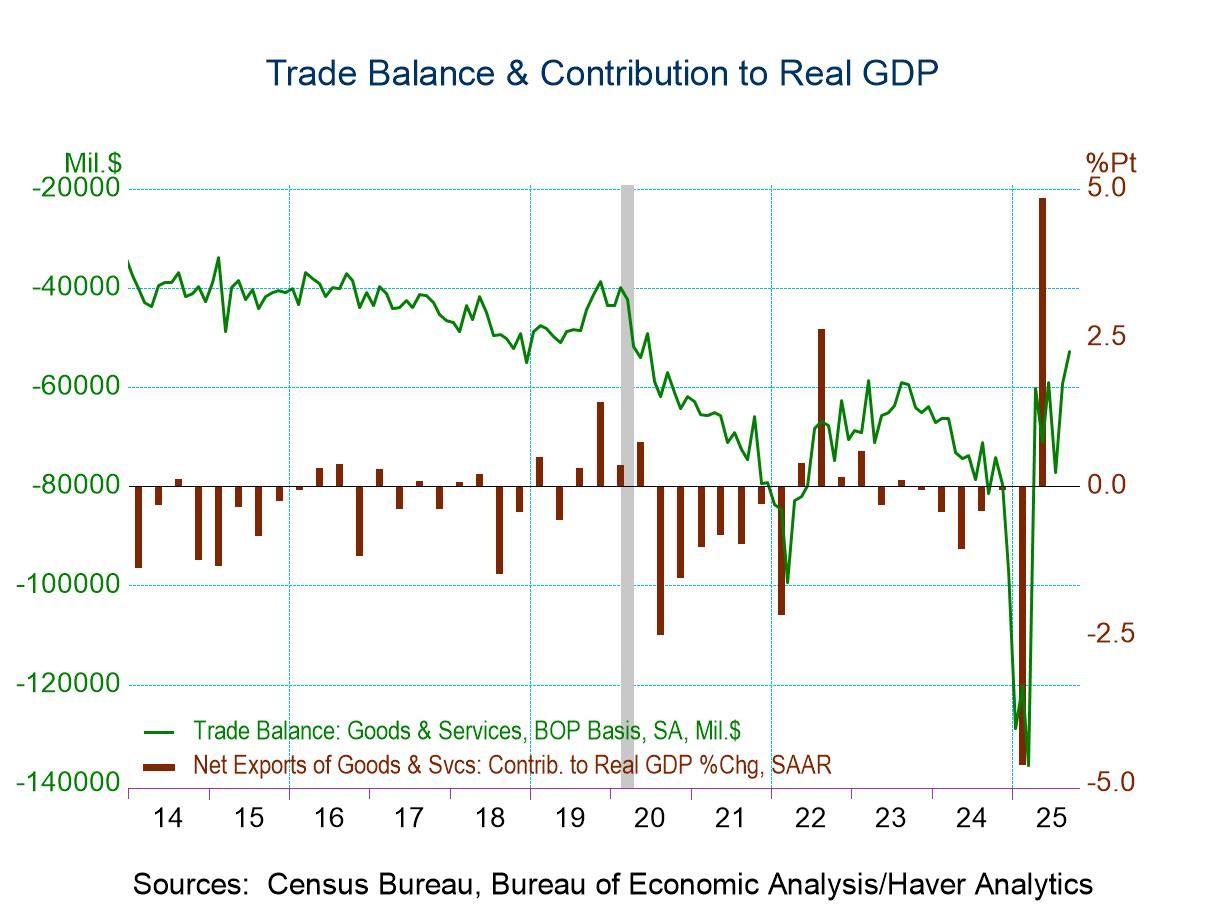
U.S. Trade Deficit Narrows to Five-Year Low in September
- Foreign trade deficit shrinks to lowest since June 2020.
- Surge in exports is driven by foods, industrial supplies & nonauto consumer goods.
- Minimal import increase is held down by fewer capital goods, autos & foods.
- Services surplus eases.
by:Tom Moeller
|in:Economy in Brief
 USA| Dec 10 2025
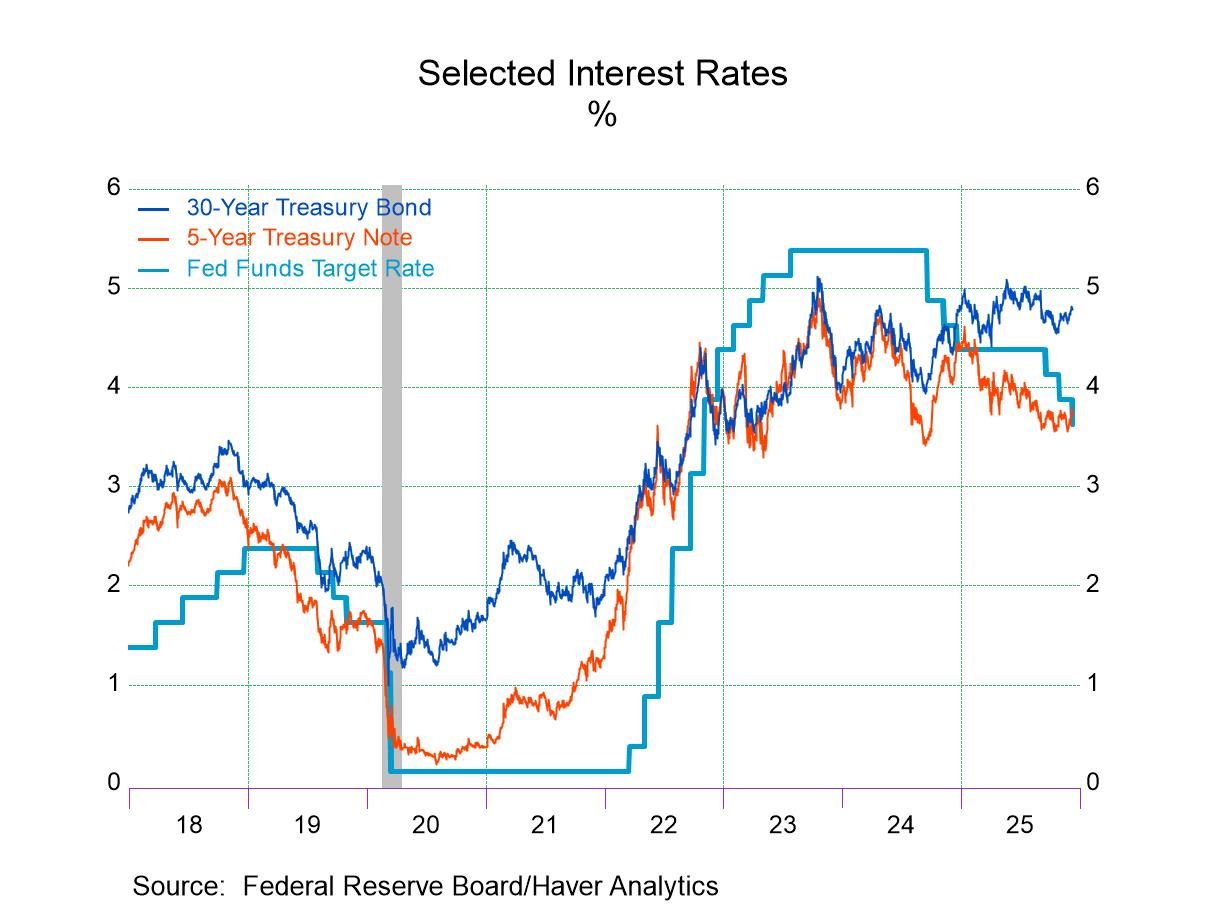
FOMC Lowers Fed Funds Rate Target as Expected
- Rate target lowered by quarter point for third time this year.
- The decision was mixed amongst FOMC voters.
by:Tom Moeller
|in:Economy in Brief
 USA| Dec 10 2025
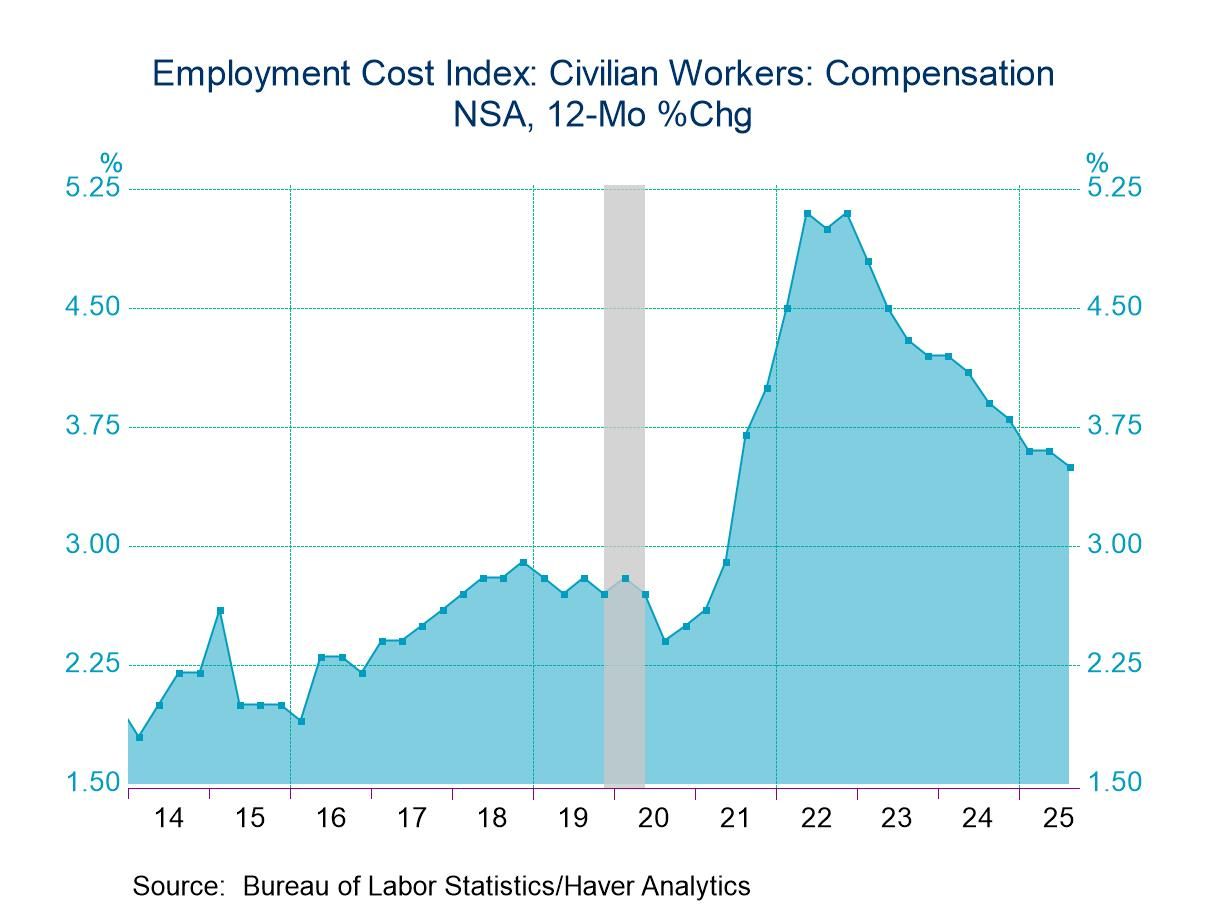
U.S. Employment Cost Index Growth Eases in Q3’25
- Compensation continues to decelerate.
- Wage growth eases.
- Benefits increase edges up.
by:Tom Moeller
|in:Economy in Brief
 USA| Dec 09 2025
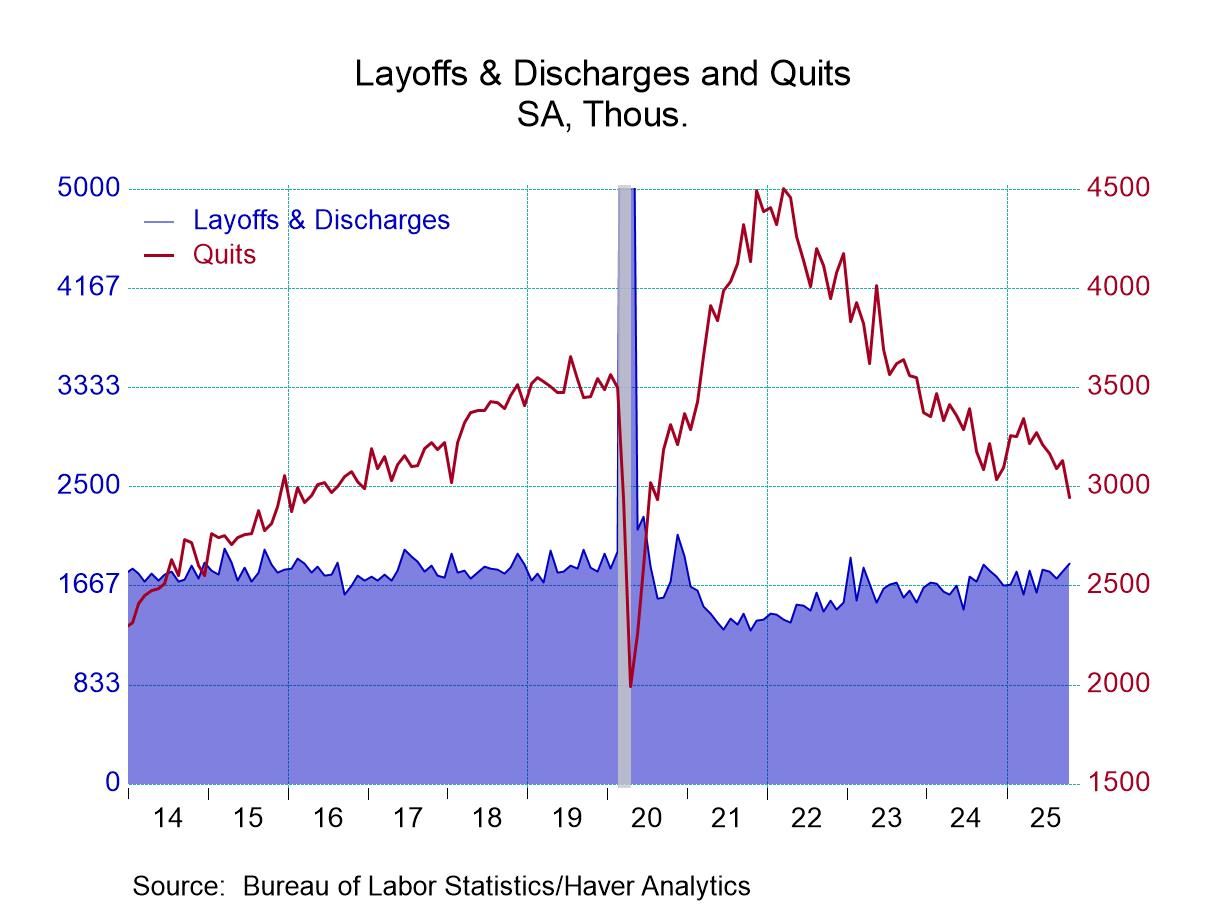
U.S. JOLTS—Openings Rise Slightly; Hiring Declines in October
- Minimal rise in job openings follows sharp September increase.
- Sizable hiring decline reverses earlier increase.
- Separations fall sharply as quits plunge and layoffs rise.
by:Tom Moeller
|in:Economy in Brief
 USA| Dec 09 2025
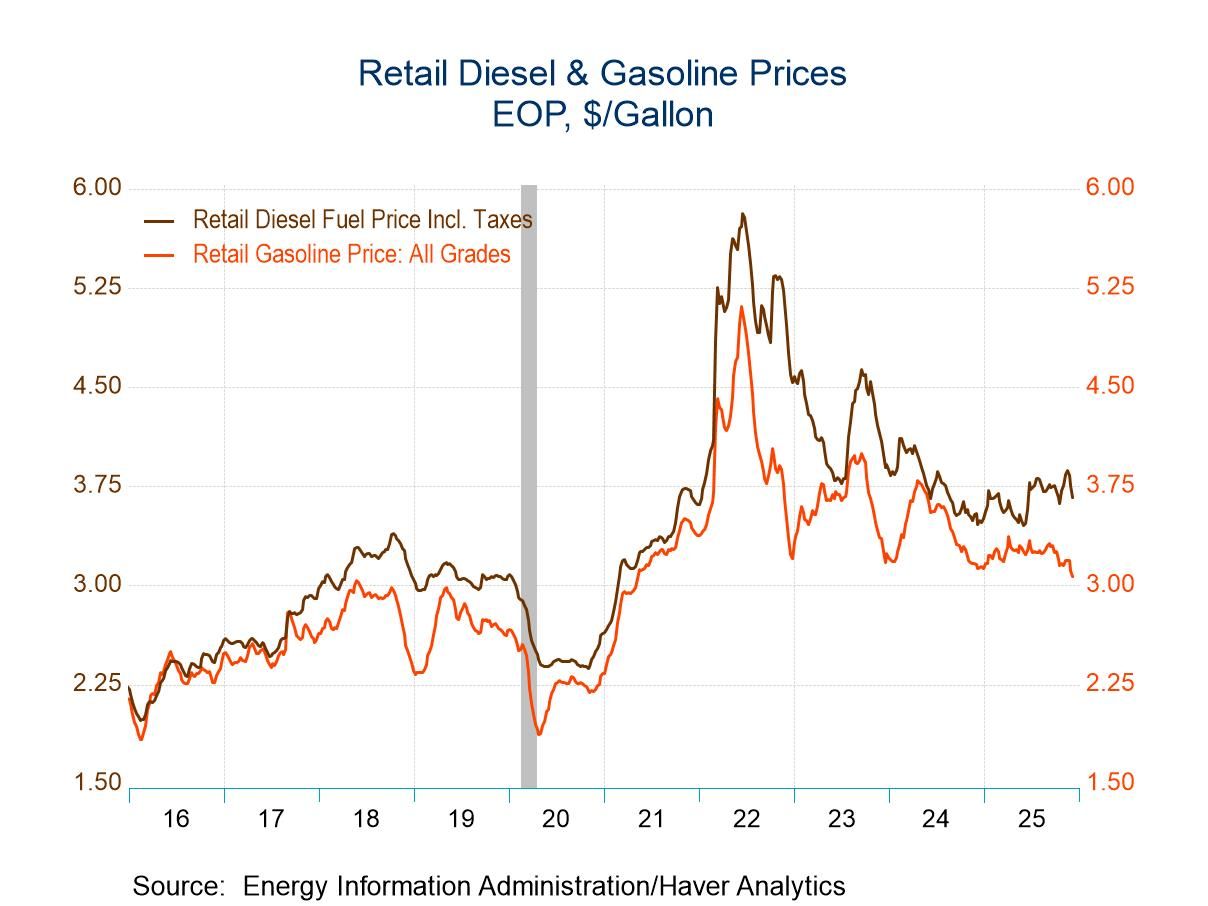
U.S. Energy Prices Remain Mixed in Latest Week
- Gasoline prices fall sharply to four-year low.
- Crude oil prices reverse prior week’s decline.
- Natural gas prices move to highest level since February.
- Gasoline demand falls sharply y/y.
by:Tom Moeller
|in:Economy in Brief
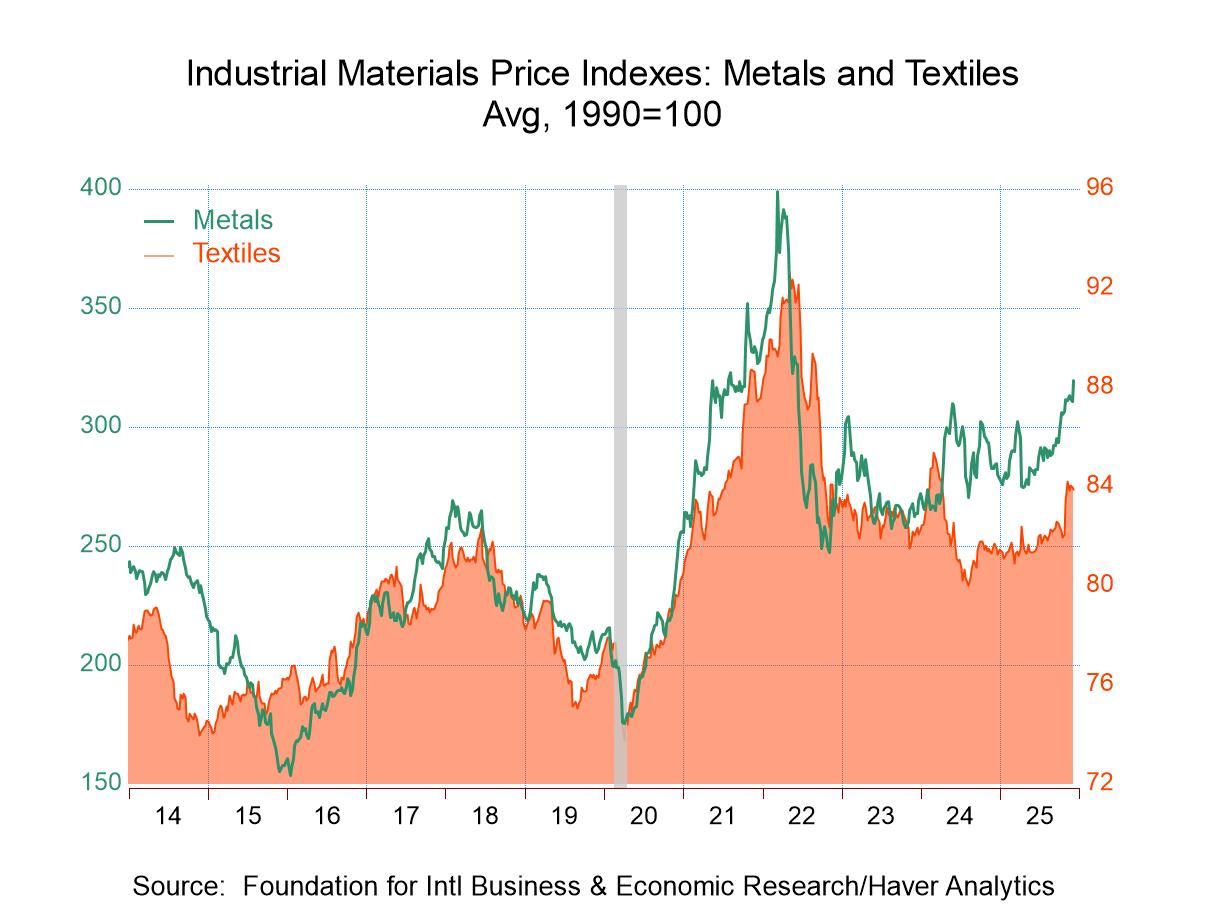
- Higher metals prices lead upturn.
- Crude oil & framing lumber prices also rise.
- Textile prices ease.
by:Tom Moeller
|in:Economy in Brief
 USA| Dec 05 2025
U.S. PCE Core Price Index Gain Eases; Personal Spending Growth Slows & Income Steadies in September
- Total PCE price index drifts up even as core price gain dips.
- Real PCE gain slips as goods outlays fall.
- Personal income gain steadies.
by:Tom Moeller
|in:Economy in Brief
 USA| Dec 04 2025
U.S. Factory Orders Unexpectedly Increase in September
- Shipments are steady.
- Order backlogs post firm increase.
- Both durable & nondurable goods inventories slip.
by:Tom Moeller
|in:Economy in Brief
- of1081Go to 1 page