 Global| Nov 14 2006
3rd Q GDP: Japan Surprises, Europe Disappoints Germany's ZEW Survey: More Cautious Expectations
Summary
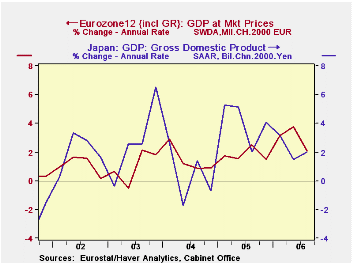
The third quarter preliminary estimate of Gross Domestic Product for Japan was twice as high as consensus expectations. On a seasonally adjusted annual rate, Japan's GDP rose 2.03% while the expected increase was 1.0%. The rise took [...]

The third quarter preliminary estimate of Gross Domestic Product for Japan was twice as high as consensus expectations. On a seasonally adjusted annual rate, Japan's GDP rose 2.03% while the expected increase was 1.0%. The rise took place in spite of a 2.98% decline in consumer expenditures. This decline was, however, outweighed by a 2.92% increase in business fixed investment, an 11.18% increase in exports, a 0.57% decline in imports and a 2.0 trillion 2000 chained yen increase in inventories, the result, in part perhaps, of the decline in consumer spending.
For the Euro Zone as a whole, the preliminary 3rd quarter GDP rose 0.5% from the second quarter, slightly below the expectation of a 0.6% rise. On a seasonally adjusted annual rate basis, the rise was 2.1%, slightly higher than the rise in Japan. The first chart compares the annual rates of changes in GDP in Japan and the Euro Zone. (In the United States GDP rose 1.6% at an annual rate, in the third quarter.)
The performance among the Euro Zone countries was mixed. France, which reported its flash estimate earlier, showed no change in the third quarter after a 4.9% annual rate increase in the second quarter. Part of the poor performance was explained by working day effects. Apparently, INSEE over estimated the effects of a newly introduced June public holiday in the second quarter. Since not all workers took advantage of the holiday, the second quarter estimate was probably overstated and the third quarter understated.
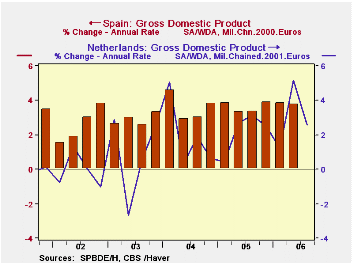
Of the other Euro Zone countries reporting, Italy, the Netherlands, Spain and Germany, GDP growth decelerated in the third quarter. The deceleration was most marked in the Netherlands, Italy and Germany. The growth rate in the Netherlands fell to 2.57% in the third quarter from 5.15%in the second quarter. Comparable figures for Italy were 1.31% and 2.58%. and for Germany, 2.57% and 4.35%. The least deceleration was in Spain where the rise in the third quarter was 3.49% compared with 3.79% in the second quarter. The second chart compares the annual rates of change in GDP in Spain and the Netherlands. The relative stability in growth Spain contrasts with the more volatile growth in the Netherlands.
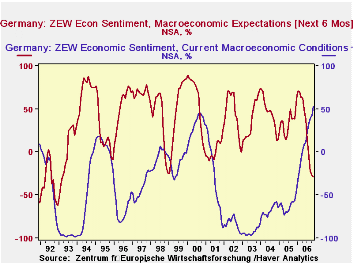
The German ZEW survey of institutional investors and financial analysts for November was released today. The participants continue to be pleased with the current situation. The excess of optimists over pessimists regarding the current situation rose to 53% in November, the highest percent balance in the history of the survey which was begun in December 1991. But the pessimists continue to dominate the expectations six months ahead. In November the excess of pessimists over optimists increased slightly to 28.5% from 27.4% in October. One has to go back to 1991 and 1993 to find larger excesses of pessimists. The third chart shows the opinions of the participants regarding the current situation and the expectations for six months ahead during the entire history of the ZEW survey.
| GROSS DOMESTIC PRODUCT (Percent change Q/Q AR) | Q3 06 | Q2 06 | Q1 06 | Q4 05 | Q3 05 | 2005 % | 2004 % | 2003 % |
|---|---|---|---|---|---|---|---|---|
| Japan | 2.03 | 1.51 | 3.17 | 4.09 | 2.03 | 2.69 | 2.13 | 1.96 |
| Euro Zone | 2.10 | 3.78 | 3.13 | 1.51 | 2.52 | 1.48 | 1.69 | 0.79 |
| United States | 1.58 | 2.56 | 5.55 | 1.76 | 4.18 | 3.22 | 3.91 | 2.51 |
| Germany | 2.57 | 4.35 | 3.24 | 1.09 | 2.08 | 1.10 | 0.77 | -0.20 |
| France | 0.00 | 4.91 | 1.79 | 1.11 | 2.78 | 1.19 | 2.03 | 1.19 |
| Italy | 1.31 | 2.58 | 3.13 | -0.07 | 1.28 | 0.11 | 0.88 | 0.11 |
| Netherlands | 2.57 | 5.15 | 1.23 | 2.51 | 3.11 | 1.53 | 1.95 | 0.34 |
| Spain | 3.49 | 3.79 | 3.86 | 3.90 | 3.36 | 3.53 | 3.45 | 2.96 |
| GERMANY ZEW INDICATOR (% BALANCE) |
Nov 06 | Oct 06 | Sep 06 | Aug 05 | Jul 05 | 2005 % | 2004 % | 2003 % |
| Current Conditions | 53.0 | 42.9 | 38.9 | 33.6 | 23.3 | -61.8 | -67.7 | -93.6 |
| Expectations 6 Months Ahead | -28.5 | -27.4 | -22.2 | -5.6 | 15.1 | 34.8 | 44.6 | 38.4 |


