 Global| Dec 14 2009
A Pause In Economic Activity In The European Union
Summary
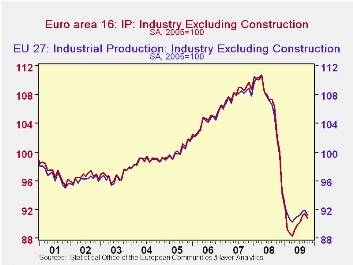
After rising for five consecutive months, industrial production fell 0.6% in the Euro Area in October and 0.7% in the entire European Union. The attached chart shows the index of Industrial Production (2005=100) for the Euro Area and [...]

After rising for five consecutive months, industrial production fell 0.6% in the Euro Area in October and 0.7% in the entire European Union. The attached chart shows the index of Industrial Production (2005=100) for the Euro Area and the European Union. There is a spurious correlation between the two series due the fact that the EU series includes the EA series. As with much of the data on the Euro Area and the European Union it is not possible to derive a non Euro Area part of the European Union.
Not all of the countries of the European Union have reported October data. Euro stat's totals for the Euro Area and the European Union include their estimates of the missing data and these estimates are not published. The totals are, therefore, preliminary and frequently revised.
In the Euro Area, the big three--Germany experienced a 1.8% decline in industrial production, France, a 0.9% decline and Italy, a 0.5% increase. Declines were recorded in Ireland, 2.8%, Greece, 0.8%, Portugal, 1.4%. The biggest decline in production in the Euro area, that of Slovenia, was 3.2%. The largest increase in production in the Euro Area was in Finland at 2.2%.
Of the published data, among the non Euro Area countries, industrial production in the UK declined 0.1%, and in Sweden, 0.5%. Industrial Production in Latvia and Lithuania increased 0.1% and 0.4% respectively. Production in Bulgaria rose 2.1%, the first increase since September, 2008.
| Industrial Production (2005=100) | Oct 09 | Sep 09 | Aug 09 | Jul 09 | Jun 09 | May 08 | Apr 08 |
|---|---|---|---|---|---|---|---|
| European Area (m/m % change) | -0.73 | 0.12 | 0.68 | 0.18 | 0.32 | 0.53 | -0.39 |
| European Union (m/m % change) | -0.61 | 0.21 | 1.13 | 0.26 | 0.86 | 1.06 | -0.47 |
| Bulgaria | 2.1 | -3.6 | -0.21 | -0.5 | -0.6 | -1.4 | -0.1 |
| Slovenia | -3.2 | 0.7 | 8.0 | -0.6 | 0.3 | 2.9 | -4.2 |
| Ireland | -2.8 | 11.3 | -16.0 | 7.9 | 7.3 | -3.6 | -3.5 |
| Finland | 2.2 | -1.7 | 2.4 | -1.6 | 1.5 | -0.7 | -1.9 |


