 Global| Mar 12 2012
A Record Trade Deficit For China
Summary
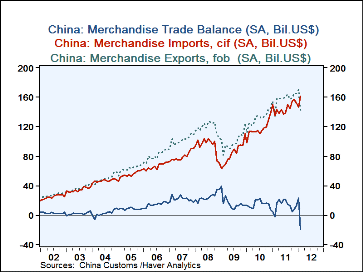
China's exports of goods declined a record $28 billion in February and imports increased $14.4 billion leaving the country with a $19.3 billion trade deficit, the largest in recent history and $42.2 billion larger than the deficit in [...]
 China's exports of goods declined a record $28 billion in February and
imports increased $14.4 billion leaving the country with a $19.3 billion
trade deficit, the largest in recent history and $42.2 billion larger than
the deficit in 2011. Total exports, imports and the balance of trade are
shown in the attached chart. Trade has usually been disrupted
by the Chinese New Year--exports tend to decline and imports to rise
around the New Year. Until recently, however, the impact had not
been particularly unusual. Last year there was a small trade deficit
of $2 billions in February for the first time. This year's big
deficit suggests that in the future the impact of the New Year on the
economy may continue to be more significant than it has been in the
past. But, if this is the case, there is likely to be some make up
in the coming months when exports will increase and imports
decrease
Data on Chinese trade by country, except for the United States and the European Union, are only available with delays of several months. In addition these data do not include the revisions in the data, that are made in the total trade data. However, the 27 countries of the European Union and the United States make up a significant proportion of China's trading partners. Both the United States and the European Union improved their trade balances with China. The U. S. balance declined $4.9 billion to $15.2 billion in February of this year from $20 billion in January, while that in the EU declined much more, $7.8 billion from $11.7 billion to $3.9 billion. China's exports to the U.S. declined $4 billion in January and and imports from the U. S. 1ncreased $0.7 Billion.& For the EU, exports were down $4.5 billion and imports were up $3.3 billion.
| Feb'12 | Jan'11 | Feb'11 | M/M Chg | Y/Y Chg | 2011 | 2010 | 2000 | |
| China Total Trade in Goods | ||||||||
| Exports | 142.1 | 170.0 | 133.2 | -27.9 | 8.5 | 1890.3 | 1573.5 | 1197.0 |
| Imports | 162.1 | 147.0 | 135.2 | 14.4 | 26.2 | 1741.8 | 1394.8 | 1001.3 |
| Balance | -19.3 | 23.0 | -2.0 | -42.3 | -17.3 | 148.4 | 178.8 | 195.6 |
| Trade With USA | ||||||||
| Exports | 26.3 | 30.3 | 23.4 | -4.1 | 0.9 | 322.7 | 282.0 | 220.0 |
| Imports | 11.0 | 10.3 | 10.1 | 0.7 | 2.8 | 121.8 | 104.7 | 77.5 |
| Balance | 15.2 | 20.0 | 13.4 | -4.9 | 1.8 | 120.9 | 180.3 | 142.6 |
| Trade With EU | ||||||||
| Exports | 24.7 | 29.2 | 25.5 | -4.5 | -0.8 | 354.7 | 310.0 | 235.2 |
| Imports | 20.8 | 17.5 | 16.1 | 3.3 | 4..7 | 210.0 | 168.3 | 122.87. |
| Balance | 3.9 | 11.7 | 9.4 | -7.8 | -5.5 | 143.9 | 142.6 | 107.4 |
More Economy in Brief
 Global| Feb 05 2026
Charts of the Week: Balanced Policy, Resilient Data and AI Narratives
by:Andrew Cates


