 Global| Jan 11 2007
Big Gain in Australia Employment; Unemployment Remains at All-Time Low
Summary
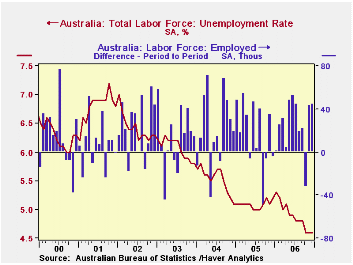
Employment in Australia grew 45,000 in the month of December, about the same as in November and far above the consensus expectation of 15,000 given in one news service forecast survey. This put the year-to-year growth rate at 3.0%. [...]

Employment in Australia grew 45,000 in the month of December, about the same as in November and far above the consensus expectation of 15,000 given in one news service forecast survey. This put the year-to-year growth rate at 3.0%.
The number of Australians unemployed rose 2,200 following a 3,800 increase in November. But these small increases still left the total unemployed right at 500,000, among the lowest since the early months of 1990. The resulting unemployment rate remained at 4.6% for a third consecutive month, the lowest in the almost-29-year history of these labor force data.
This labor market performance is impressive as it accompanied a rise in the participation rate from 64.78% to 64.95%, near the all-time high of 65.02% reached in September. [The Bureau of Statistics publishes the participation rate rounded to one decimal place. We calculated the rate from labor force and population series so we could see more precise changes.]
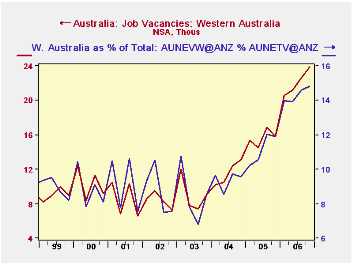
Further, in Q4, separate data reported Wednesday show job vacancies at an all-time high of nearly 164,000, up more than 21% from the year-ago period. as seen in our second graph, much of the strength is in Western Australia -- Perth -- perhaps owing to growing trade in Indian Ocean territories. Queensland also shows gains. The two greatest population centers, New South Wales (Sydney) and Victoria (Melbourne) are seeing a steady number of reported job vacancies.
So the Australian labor market is doing well and, with rising vacancies, perhaps can sustain that track.
These data are contained in Haver's "ANZ" database and in "G10".
| AUSTRALIA (Months Seas Adj) | Dec 2006 | Nov 2006 | Oct 2006 | Dec 2005 | 2006 | 2005 | 2004 |
|---|---|---|---|---|---|---|---|
| Unemployment Rate (%) | 4.6 | 4.6 | 4.6 | 5.2 | 4.9 | 5.1 | 5.5 |
| Employment (000s) | 10337 | 10293 | 10250 | 10035 | 10190 | 9987 | 9677 |
| Change(000s)/Yr- to-Yr % Change | +45 | +43 | -32 | 3.0 | 2.0 | 3.2 | 2.1 |
| Participation Rate (%) | 64.95 | 64.78 | 64.61 | 64.39 | 64.70 | 64.44 | 63.57 |
| Job Vacancies (000s) | 164 (Q4) | 135 (Q4) | 154 | 140 | 124 | ||
Carol Stone, CBE
AuthorMore in Author Profile »Carol Stone, CBE came to Haver Analytics in 2003 following more than 35 years as a financial market economist at major Wall Street financial institutions, most especially Merrill Lynch and Nomura Securities. She has broad experience in analysis and forecasting of flow-of-funds accounts, the federal budget and Federal Reserve operations. At Nomura Securites, among other duties, she developed various indicator forecasting tools and edited a daily global publication produced in London and New York for readers in Tokyo. At Haver Analytics, Carol is a member of the Research Department, aiding database managers with research and documentation efforts, as well as posting commentary on select economic reports. In addition, she conducts Ways-of-the-World, a blog on economic issues for an Episcopal-Church-affiliated website, The Geranium Farm. During her career, Carol served as an officer of the Money Marketeers and the Downtown Economists Club. She has a PhD from NYU's Stern School of Business. She lives in Brooklyn, New York, and has a weekend home on Long Island.


