 Global| Mar 22 2010
Canadian Consumer Prices
Summary
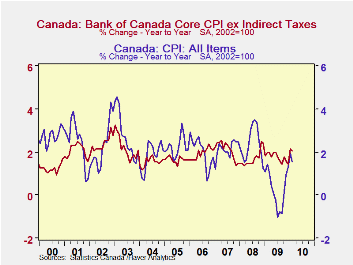
Canadian consumer prices, seasonally adjusted, increased 1.57% in February from a year ago. The core index showed a larger increase, 2.04%. The core index has been rising faster than the total index since November 2008, as can be seen [...]

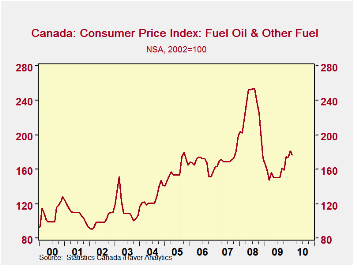
Canadian consumer prices, seasonally adjusted, increased 1.57% in February from a year ago. The core index showed a larger increase, 2.04%. The core index has been rising faster than the total index since November 2008, as can be seen in the first chart. The core index usually rises more slowly than the total index since the idea behind the core index is to exclude those items whose prices are particularly volatile, like food and energy. However, when the prices of such items decline faster that the general price level, the Core index will rise faster than the Total index. The second chart shows the sharp decline in the price of fuel oil and other fuels that took place from late 2008 until the summer of 2009. The rise since then suggests that sooner or later, the Total Index will be rising faster than the Core.
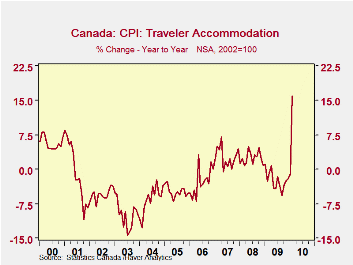
Buried in the extensive detail of the index is a component entitled Travel Accommodations that would not ordinarily cause comment, however, the rise of this component in February was striking as can be seen in the third chart. The rise was due apparently to increases in the prices of hotel rooms and other travel accommodations during the Olympics at Vancouver. The impact on the total index, was muted as the weight of the Travel Accommodation component is only 1.15%.
The actual indexes and the weights are found in the Haver Data Base, CANSIM.


| Feb 10 | Jan 09 | Feb 09 | M/M Chg | Y/Y Chg | 2009 | 2008 | 2007 | |
|---|---|---|---|---|---|---|---|---|
| Total Index (SA, 2002=100) | 116.1 | 116.0 | 114.3 | 0.09 | 1.57 | 114.0 | 114.1 | 111.4 |
| Core Index (SA, 2002=100) | 115.3 | 114.9 | 113.0 | 0.35 | 2.04 | 113.6 | 111.7 | 109.8 |
| Total Index (NSA, 2002=100) | 115.6 | 115.1 | 113.8 | 0.42 | 1.58 | 114.4 | 114.1 | 111.5 |
| Fuel Oil and other Fuels | 176.0 | 181.6 | 157.6 | -3.08 | 11.68 | 158.0 | 225.4 | 122.5 |
| Travel Accommodations (NSA, 2002=100) | 87.8 | 74.0 | 75.7 | 18.65 | 15.98 | 79.7 | 81.8 | 79.8 |
More Economy in Brief
 Global| Feb 05 2026
Charts of the Week: Balanced Policy, Resilient Data and AI Narratives
by:Andrew Cates


