 Global| Jan 25 2007
China GDP Grows 10.7% in 2006, But Manufacturing Gains Appear To Moderate Late in the Year
Summary
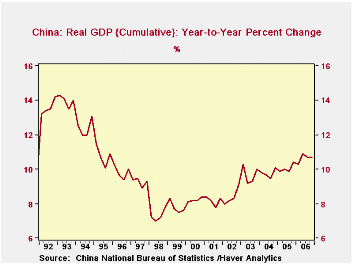
China's economy continued to expand rapidly in Q4, according to GDP data reported today (Jan 25). The Q4 GDP was 10.4% above that for Q4 2005, making the whole year 10.7% above 2005. This was the strongest yearly performance since [...]

China's economy continued to expand rapidly in Q4, according to GDP data reported today (Jan 25). The Q4 GDP was 10.4% above that for Q4 2005, making the whole year 10.7% above 2005. This was the strongest yearly performance since 1995.
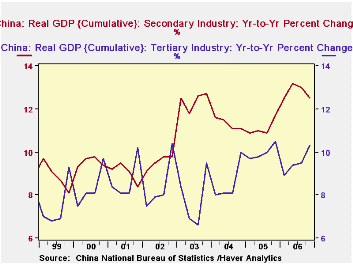
China, of course, has become the world's manufacturing center, and it is that industrial sector that drove the further acceleration in the annual outcome. This is called secondary industry by the Chinese national accounts compilers; the product of that segment expanded by 12.5% in the year, about the same as 12.7% in 2003, and otherwise the largest growth since 1995. The secondary industries are manufacturing, mining, utilities and construction. Primary industries, which include agriculture, forestry and fishing, expanded 5.0%, and tertiary industries, basically the service sector, grew 10.3%, about in line with the last seven or eight years' gains. 
While these data are "provisional" according to China's National Bureau of Statistics, they do contain a hint of slowing in the key secondary industry sector. Its gross product had been up as much as 13.2% in Q2, year-to-date over the comparable year-ago period. So there has apparently been moderate easing through the second half of the year to the cumulative total of 12.5%. This is also apparent in monthly data on industrial production. Year-on-year growth rates in the autumn months had decreased to 14-3/4% from 18% in the spring. This of course still shows dramatic strength -- which indeed may elicit interest rate increases from the Central Bank -- but the less ebullient performance does suggest that there may be some capacity limits on Chinese activity. We could guess they are at least partially energy-related.
| CHINA | Q4 2006 | Q3 2006 | Q2 2006 | Year Ago | 2006 | 2005 | 2004 |
|---|---|---|---|---|---|---|---|
| Real GDP: Yr/Yr % Change | 10.4 | 10.6 | 11.5 | 9.9 | 10.7 | 9.9 | 9.5 |
| Year-to-Date % Change | 10.7 | 10.7 | 10.9 | 10.4 | 10.7 | 10.4 | 10.1 |
| Primary Industries | 5.0 | 4.9 | 5.1 | 5.2 | 5.0 | 5.2 | 6.3 |
| Secondary Industries | 12.5 | 13.0 | 13.2 | 11.7 | 12.5 | 11.7 | 11.1 |
| Tertiary Industries | 10.3 | 9.5 | 9.4 | 10.5 | 10.3 | 10.5 | 10.0 |
| Nominal GDP: Bil.Yuan | 5,659.6 | 5,129.3 | 5,024.1 | 4,820.0 | 20,834.0 | 18,232.1 | 15,987.0 |
| Bil.US$ | 719.9 | 644.0 | 627.2 | 596.3 | 2,614.7 | 2,226.1 | 1,931.6 |
Carol Stone, CBE
AuthorMore in Author Profile »Carol Stone, CBE came to Haver Analytics in 2003 following more than 35 years as a financial market economist at major Wall Street financial institutions, most especially Merrill Lynch and Nomura Securities. She had broad experience in analysis and forecasting of flow-of-funds accounts, the federal budget and Federal Reserve operations. At Nomura Securities, among other duties, she developed various indicator forecasting tools and edited a daily global publication produced in London and New York for readers in Tokyo. At Haver Analytics, Carol was a member of the Research Department, aiding database managers with research and documentation efforts, as well as posting commentary on select economic reports. In addition, she conducted Ways-of-the-World, a blog on economic issues for an Episcopal-Church-affiliated website, The Geranium Farm. During her career, Carol served as an officer of the Money Marketeers and the Downtown Economists Club. She had a PhD from NYU's Stern School of Business. She lived in Brooklyn, New York, and had a weekend home on Long Island.
More Economy in Brief
 Global| Feb 05 2026
Charts of the Week: Balanced Policy, Resilient Data and AI Narratives
by:Andrew Cates


