 Global| Jan 10 2012
China's December Trade Data Suggest Slower Economic Growth
Summary
China's seasonally adjusted trade surplus increased $9.6 billion in December to $13.5 billion from $3.9 in November. Exports were down $1.6 billion from $165.4 billion in November to $163.9 billion in December. The chief source of the [...]
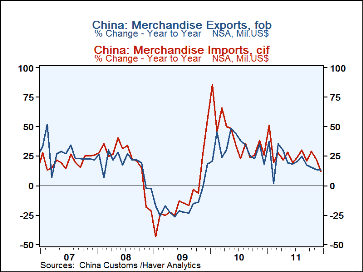
China's seasonally adjusted trade surplus increased $9.6 billion in December to $13.5 billion from $3.9 in November. Exports were down $1.6 billion from $165.4 billion in November to $163.9 billion in December. The chief source of the rise in the trade surplus was an $11.2 billion drop in imports from $161.5 billion to $150.3 billion, suggesting a slowing economy. On an unadjusted basis exports were up $0.3 billion as opposed to a decline and imports were up only $1.6 billion. The balance was $1.9 billion as opposed to $9.6 billion after seasonal adjustment. Year to year growth in the unadjusted data, however, confirms the slow down in imports. The year over year percent change in the unadjusted imports fell to 11.8% in December from 22.0% in November. The year to year change in exports was more subdued, from 13.7% in November to 13.4% in December, as can be seen in the first chart.
China records imports by country, but, on a delayed basis, for many countries,. Among the data that are available, imports from Australia, Brazil, Thailand, South Korea , Indonesia and Hong Kong were lower in December than they were in November.
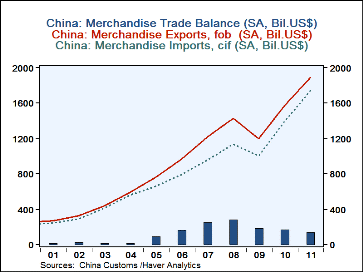
For the year as a whole, exports were $1,890 billion, imports, $1,742 billion and the balance $148 billion. The balance last year was roughly half as large as the peak balance of $297 billion in 2008. Annual data for merchandise exports, imports and balances are shown in the second chart.
| CHINA TRADE | Dec 11 |
Nov 11 |
Dec 10 |
Chg M/M |
Chg Y/Y |
2011 | 2010 | 2009 | 2008 |
|---|---|---|---|---|---|---|---|---|---|
| Exports(SA, Bil. USD) | 163.9 | 165.4 | 145.1 | -1.6 | 18.8 | 1890 | 1573 | 1197 | 1428 |
| Imports(SA, Bil. USD) | 150.3 | 161.5 | 135.7 | -11.2 | 14.5 | 1742 | 1395 | 1002 | 1134 |
| Balance(SA, Bil. USD) | 13.5 | 3.9 | 9.3 | 9.6 | 3.2 | 148 | 178 | 195 | 294 |
| Exports(NSA, Bil. USD) | 174.7 | 174.4 | 154.1 | 0.3 | 20.6 | 1899 | 1578 | 1202 | 1430 |
| Imports(NSA, Bil. USD) | 158.2 | 159.8 | 141.5 | 1.6 | 16.7 | 1742 | 1396 | 1006 | 1132 |
| Balance(NSA, Bil. USD) | 16.5 | 14.6 | 12.6 | 1.9 | 3.9 | 157 | 182 | 196 | 297 |
| Imports From | Dec 11 | Nov 11 | Change | ||||||
| Australia (NSA, Bil. USD) | 7286 | 8262 | -976 | ||||||
| Brazil | 4453 | 5056 | -603 | ||||||
| Hong Kong | 1068 | 1475 | -407 | ||||||
| South Korea | 14626 | 14351 | -274 | ||||||
| Indonesia | 3266 | 3462 | -196 | ||||||


