 Global| Apr 16 2002
Consumer Prices Up Less Than Expected
by:Tom Moeller
|in:Economy in Brief
Summary
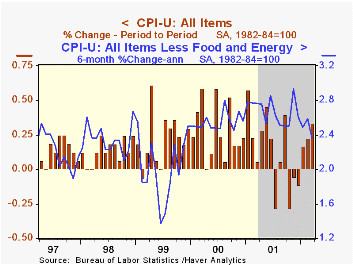
Consumer prices rose less than expected last month. Core inflation also rose less than Consensus expectations for a 0.2% gain. As expected, energy prices were strong led by an 8.0% gain in gasoline prices and a 1.7% rise in fuel oil [...]

Consumer prices rose less than expected last month. Core inflation also rose less than Consensus expectations for a 0.2% gain.
As expected, energy prices were strong led by an 8.0% gain in gasoline prices and a 1.7% rise in fuel oil prices. Piped gas and electricity prices rose just 0.2% (-8.1% y/y), only the third monthly increase in fifteen months.
Core inflation was quite tame due to another decline in consumer goods prices. Tobacco prices, down 3.5%, about completely reversed the rise the prior month. Home furnishings prices were unchanged following two months down. New vehicle prices fell for the third consecutive month. Apparel prices rose a strong 1.2% but remained down 3.1% y/y.
Services prices less energy also rose just modestly. Shelter prices gained 0.1%, the weakest increase since September but medical care services rose 0.4% (4.7% y/y). Public transportation prices fell for the second consecutive month.
| Consumer Price Index | Mar | Feb | Y/Y | 2001 | 2000 | 1999 |
|---|---|---|---|---|---|---|
| Total | 0.3% | 0.2% | 1.4% | 2.8% | 3.4% | 2.2% |
| Total less Food & Energy | 0.1% | 0.3% | 2.4% | 2.7% | 2.4% | 2.1% |
| Goods less Food & Energy | -0.1% | 0.0% | -1.1% | 0.3% | 0.5% | 0.7% |
| Services less Energy | 0.1% | 0.4% | 3.9% | 3.7% | 3.3% | 2.7% |
| Energy | 3.8% | -0.8% | -10.5% | 3.7% | 16.9% | 3.6% |
| Food & Beverages | 0.2% | 0.2% | 2.6% | 3.1% | 2.3% | 2.1% |
by Tom Moeller April 16, 2002

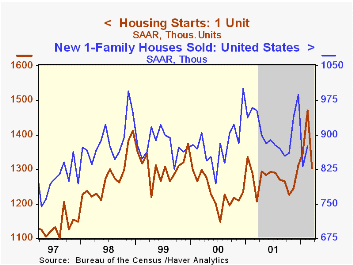
Housing starts fell about as expected last month. The surge in February was revised up slightly due to a raised estimate for single family starts.
Single-family starts fell 11.4%, but for the quarter rose a sharp 8.9% versus 4Q01.
Multi-family starts rose 8.9%, recouping some of the sharp decline the prior month.
Starts fell in each of the country's regions except for a 15.5% surge in the Northeast.
Building permits fell sharply following four months of strong gain.
| Housing Starts (000s, AR) | Mar | Feb | Y/Y | 2001 | 2000 | 1999 |
|---|---|---|---|---|---|---|
| Total | 1,646 | 1,785 | 3.4% | 1,608 | 1,575 | 1,647 |
| Single Family | 1,303 | 1,470 | 7.9% | 1,276 | 1,233 | 1,306 |
| Multi Family | 343 | 315 | -10.7% | 332 | 342 | 341 |
by Tom Moeller April 16, 2002

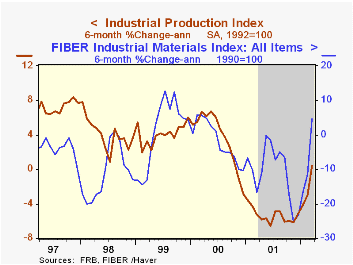
Industrial production rose in March for the third month in a row led by a 0.8% gain in factory sector output, the strongest monthly increase since March 2000. February figures were little revised. Production rose 2.5% (AR) versus 4Q.
Excluding high tech, production rose 0.7% following a 0.2% February gain and a 0.4% January rise.
Output of appliances/furniture/carpeting rose a strong 1.3% following a 2.7% February gain. Business equipment rose just 0.1%, held back by a sharp drop in transportation equipment. Output of info processing equipment, up 1.1%, rose for the third straight month.
Capacity utilization rose for the third month. Capacity has increased just 0.1% monthly since March of last year.
| Production & Capacity | Mar | Feb | Y/Y | 2001 | 2000 | 1999 |
|---|---|---|---|---|---|---|
| Industrial Production | 0.7% | 0.4% | -2.9% | -3.7% | 4.5% | 3.7% |
| Capacity Utilization | 75.4% | 74.9% | 78.5%(3/01) | 76.8% | 81.8% | 81.4% |
by Tom Moeller April 16, 2002

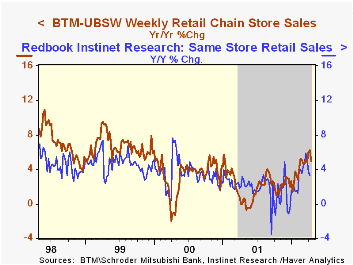
Chain store sales fell 0.7% in the first full week of April. Early April sales are 1.0% below the March average.
Weakness in April sales is supported by the Redbook sales figures where, through the prior week, same store sales gains slowed to 3.3% from 4.7% in March.
During the last ten years there has been a 20% correlation between the monthly percent change in chain store sales and the change in consumer confidence.
| BTM-UBSW (SA, 1977=100) | 4/13/02 | 4/06/02 | Y/Y | 2001 | 2000 | 1999 |
|---|---|---|---|---|---|---|
| Total Weekly Retail Chain Store Sales | 400.8 | 403.7 | 5.0% | 2.1% | 3.4% | 6.7% |
Tom Moeller
AuthorMore in Author Profile »Prior to joining Haver Analytics in 2000, Mr. Moeller worked as the Economist at Chancellor Capital Management from 1985 to 1999. There, he developed comprehensive economic forecasts and interpreted economic data for equity and fixed income portfolio managers. Also at Chancellor, Mr. Moeller worked as an equity analyst and was responsible for researching and rating companies in the economically sensitive automobile and housing industries for investment in Chancellor’s equity portfolio. Prior to joining Chancellor, Mr. Moeller was an Economist at Citibank from 1979 to 1984. He also analyzed pricing behavior in the metals industry for the Council on Wage and Price Stability in Washington, D.C. In 1999, Mr. Moeller received the award for most accurate forecast from the Forecasters' Club of New York. From 1990 to 1992 he was President of the New York Association for Business Economists. Mr. Moeller earned an M.B.A. in Finance from Fordham University, where he graduated in 1987. He holds a Bachelor of Arts in Economics from George Washington University.
More Economy in Brief
 Global| Feb 05 2026
Charts of the Week: Balanced Policy, Resilient Data and AI Narratives
by:Andrew Cates


