 Global| Aug 15 2007
Daily Fed Open Market Operations: The Pattern of Fed Liquidity Provision
Summary
Every business day at about 9:30, the New York Federal Reserve Bank's trading desk announces the day's "temporary open market operation". These are routine transactions in which the NY Fed buys securities from the group of "primary [...]

Every business day at about 9:30, the New York Federal Reserve Bank's trading desk announces the day's "temporary open market operation". These are routine transactions in which the NY Fed buys securities from the group of "primary dealers" together with an agreement to sell them back at a later time, the familiar "repo" transaction. This is usually the next day, but can also be 3, 4, 7 or 15 days later. The effect is to add reserves to the banking system for that corresponding period, that is, to provide liquidity. If there is a surfeit of liquidity, the NY Fed may do "reverse repurchase agreements", selling securities with an arrangement to buy them back, thus draining some reserves for the day or 2 or 3 during which the transaction is in force.
In the wake of the Fed's extraordinary repo operations late last week, Haver has added some series to the DAILY database, which show the amount of each day's operations and the type of collateral used. These are simple series, with only the total dollar amount in a given day's combined transactions. The objective, then, of these series is to show the amount of liquidity added or drained, and not the market conditions prompting the operations or the specifications of individual transactions beyond the securities used for collateral. 
The source for this information is a "user-friendly" page on the New York Fed's website. The current day's transactions are described along with a link to the previous 25 transactions and to a search facility that allows reference to periods from a single specified day to the entire history since July 7, 2000. All of the information can be exported to an Excel spreadsheet.
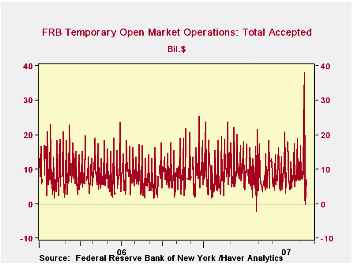
As we see in the first graph, the daily amounts of these reserve provisions vary widely. Most of the transactions are related to ordinary seasonal flows in the banking system. Today, for example, is August 15, the settlement date for the regular quarterly issues of new debt by the US Treasury. It is also the last day of a Federal Reserve "maintenance period", the bi-weekly time span over which banks are required to "meet" their reserve requirement. Today's operation added $7.0 billion. Other examples relate to developments in the real economy: in December when shopping is at its highest volume of the year, so are reserve needs. In January, when business slows way down after the holidays and in the depths of winter, reserve needs decrease markedly. There is nothing unusual about Federal Reserve additions in December or draining operations in January. 
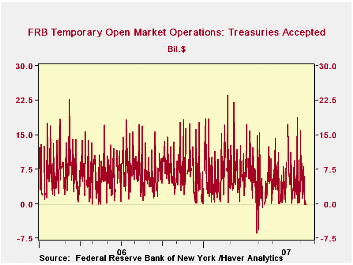
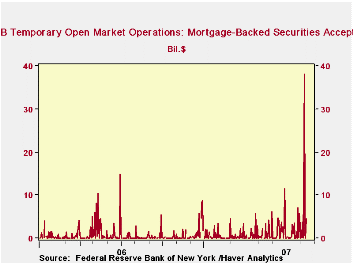
The transactions on Thursday and Friday deserve special mention. On Thursday, they totaled $24 billion. This seems large if we don't follow these daily operations. But additions on Thursdays routinely run $15 billion or more and often around $20 billion. So this alone wasn't all that dramatic an intervention. Friday's operations, though, were quite distinctive. They totaled $38 billion, the largest single day's addition since the days immediately following September 11, 2001, when a number of New York dealers were briefly shut down. Also, they used mortgage-backed collateral exclusively. Demand for Treasury securities is strong in the midst of market uncertainty, so it is likely that the Fed didn't want to restrain the floating supply of those securities. But mortgages, of course, are the source of much of the present market dislocations. Our third graph here shows how unusual the volume of these repos is. At the same time, the Fed did not buy these securities outright, they only bought them to hold over the weekend. On Monday, they did a modest $2 billion operation and none on Tuesday, so those MBS returned to the markets. Even so, note that the federal funds rate remained very low on Monday and Tuesday. This indicates that normal banking system operations were providing reserves on those days, obviating the need for more Federal Reserve intervention.
| Million $ | Aug 13 | Aug 10 | Aug 9 | July* | June* | May* |
|---|---|---|---|---|---|---|
| Total | 2,000 | 38,000 | 24,000 | 8,810 | 8,464 | 8,250 |
| Treasury | 700 | 0 | 8,099 | 5,710 | 4,238 | 4,073 |
| Agency | 144 | 0 | 4,971 | 1,946 | 2,379 | 3,230 |
| Mortgage-Backed | 1,156 | 38,000 | 10,930 | 1,154 | 1,847 | 947 |
Carol Stone, CBE
AuthorMore in Author Profile »Carol Stone, CBE came to Haver Analytics in 2003 following more than 35 years as a financial market economist at major Wall Street financial institutions, most especially Merrill Lynch and Nomura Securities. She had broad experience in analysis and forecasting of flow-of-funds accounts, the federal budget and Federal Reserve operations. At Nomura Securities, among other duties, she developed various indicator forecasting tools and edited a daily global publication produced in London and New York for readers in Tokyo. At Haver Analytics, Carol was a member of the Research Department, aiding database managers with research and documentation efforts, as well as posting commentary on select economic reports. In addition, she conducted Ways-of-the-World, a blog on economic issues for an Episcopal-Church-affiliated website, The Geranium Farm. During her career, Carol served as an officer of the Money Marketeers and the Downtown Economists Club. She had a PhD from NYU's Stern School of Business. She lived in Brooklyn, New York, and had a weekend home on Long Island.
More Economy in Brief
 Global| Feb 05 2026
Charts of the Week: Balanced Policy, Resilient Data and AI Narratives
by:Andrew Cates


