 Global| Jan 10 2007
Export Growth Spread Around the Country: Texas Leads but Other States Participate
Summary
The US Census Bureau publishes a voluminous amount of foreign trade data. So along with the national summary reported on by Tom Moeller, we will highlight for you one specific set of associated data, exports by state. These shipments [...]

The US Census Bureau publishes a voluminous amount of foreign trade data. So along with the national summary reported on by Tom Moeller, we will highlight for you one specific set of associated data, exports by state.
These shipments are counted from their "origin of movement", that is where the transportation begins, rather than where the merchandise leaves the country. Census publishes total figures monthly for each state, and it publishes quarterly information on product and destination country, an extraordinarily detail dataset. The total data are contained in Haver's REGIONAL database, a wide-ranging collection of various economic data for states. The breakdown of state export data by product is a set of databases each covering a Census division of states. In EXPRQ6, for example, you can find the shipping weight of non-electrical machinery sent by ship or air from Tennessee to Aruba.
The state export totals appear in a supplemental table in the Census Bureau's main FT900 International Trade press release. In our table below, we show the US Total and a selection of states. We picked the three largest exporters, Texas, California and Washington, and also a few others from various regions: Missouri in the midwest, Georgia in the southeast and Massachusetts in New England. All these data are not seasonally adjusted and are reported in current dollars on the so-called "Census" basis.
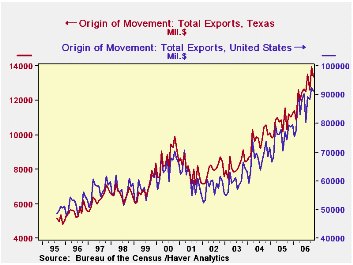
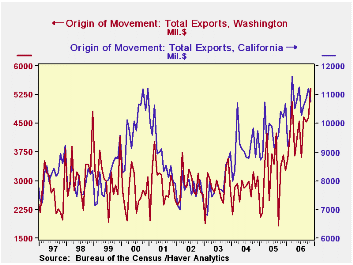
Total US exports in November were up 15.7% from a year ago. A number of states are showing more rapid expansion than that, particularly Texas, which is the largest exporter in dollar terms. It shipped $13.35 billion of merchandise to customers abroad in November, 20.9% more than November 2005. We can also compare these exports for a full year to gross state product (Haver database GSP); in 2005 they made 13% of Texas state product. California runs second in dollar value of exports, with $10.8 billion in November shipments; this was up 5.5% from the year-ago period. California exports were 7.2% of its GSP in 2005. Interestingly, Washington State is third; we haven't looked, but we'd guess that aircraft and computer software make a large portion of the goods, which amounted to $5.4 billion in November, up a whopping 47.6% from the year before; exports constitute 14.2% of Washington's gross product. [New York State's total exports are marginally larger, but include more reexports, so they would represent less value added.]
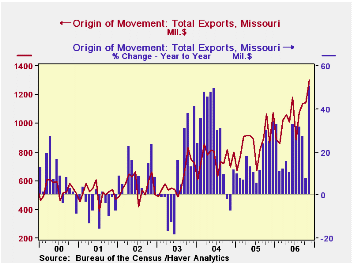
Among the other states shown here, Missouri is seeing notable expansion of its export business. While November's shipments look small at just $1.3 billion, they are up 51% from a year ago and were more than double the 2003 amount.
We'd also surmise -- without much investigation, to be sure -- that sizable overall export growth is related to the recently weak dollar. It's also important to note that outsourcing and other aspects of globalization do not work only to the detriment of the US economy. One reason for the publication of these data is a desire by officials in various states to show how their state can be competitive in world markets and thereby create jobs.
| US Exports by State (NSA, Mil.$) | Nov 2006 | Oct 2006 | Sept 2006 | 2005 | 2004 | 2003 |
|---|---|---|---|---|---|---|
| Total US | 91240 | 92476 | 88428 | 75365 | 68046 | 60312 |
| Yr/Yr % Chg | 15.7 | 16.3 | 19.0 | 10.8 | 12.8 | 4.4 |
| Texas | 13350 | 13959 | 12576 | 10730 | 9762 | 8237 |
| Yr/Yr % Chg | 20.9 | 24.8 | 21.7 | 9.9 | 18.5 | 3.6 |
| California | 10761 | 11216 | 10862 | 9735 | 9155 | 7833 |
| Yr/Yr % Chg | 5.5 | 7.6 | 13.4 | 6.3 | 16.9 | 1.9 |
| Washington | 5410 | 4651 | 4546 | 3162 | 2814 | 2848 |
| Yr/Yr % Chg | 47.6 | 37.7 | 149.3 | 12.4 | -1.2 | -1.3 |
| Missouri | 1303 | 1143 | 1135 | 872 | 748 | 603 |
| Yr/Yr % Chg | 50.8 | 7.5 | 27.4 | 34.1 | 11.9 | 41.1 |
| Massachusetts | 2034 | 2175 | 2042 | 1837 | 1818 | 1555 |
| Yr/Yr % Chg | 7.9 | 15.3 | 7.3 | 1.1 | 16.9 | 11.7 |
| Georgia | 1629 | 1801 | 1656 | 1715 | 1633 | 1357 |
| Yr/Yr % Chg | 5.4 | 8.3 | -3.2 | 5.0 | 20.3 | 13.0 |
Carol Stone, CBE
AuthorMore in Author Profile »Carol Stone, CBE came to Haver Analytics in 2003 following more than 35 years as a financial market economist at major Wall Street financial institutions, most especially Merrill Lynch and Nomura Securities. She had broad experience in analysis and forecasting of flow-of-funds accounts, the federal budget and Federal Reserve operations. At Nomura Securities, among other duties, she developed various indicator forecasting tools and edited a daily global publication produced in London and New York for readers in Tokyo. At Haver Analytics, Carol was a member of the Research Department, aiding database managers with research and documentation efforts, as well as posting commentary on select economic reports. In addition, she conducted Ways-of-the-World, a blog on economic issues for an Episcopal-Church-affiliated website, The Geranium Farm. During her career, Carol served as an officer of the Money Marketeers and the Downtown Economists Club. She had a PhD from NYU's Stern School of Business. She lived in Brooklyn, New York, and had a weekend home on Long Island.
More Economy in Brief
 Global| Feb 05 2026
Charts of the Week: Balanced Policy, Resilient Data and AI Narratives
by:Andrew Cates


