 Global| Jul 26 2007
Industry Employment in Canada Shows Manufacturing Upturn in May, Somewhat Slower Growth in Services
Summary
Statistics Canada today reported monthly data on payroll employment for May, its establishment employment survey. The total number of employees increased 6,900, roughly in line with the experience over the previous months of 2007, [...]

Statistics Canada today reported monthly data on payroll employment for May, its establishment employment survey. The total number of employees increased 6,900, roughly in line with the experience over the previous months of 2007, which averaged 8,500.
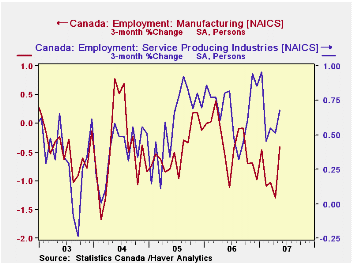
An industrial breakdown shows firmer gains, though, in both goods-producing and services-producing sectors. Goods industries saw jobs increase 18,600 and services, 27,700. The difference between the sum of the individual sectors and the total comes in a group of "unclassified enterprises". Reported employment in these firms dropped sharply in May, by 37,600 before seasonal adjustment. This is out of line with its prior behavior, and we wonder if it might be revised in a month's time or so.
Meantime, there were constructive increases in the individual sectors. The goods industries had contracted in February, March and April by a total of more than 26,000. Most of this was in manufacturing, but jobs in forestry & logging, mining and utilities also fell. May saw further and bigger declines in mining, but forestry turned sharply higher and manufacturing increased by 7,900, the strongest monthly performance since September 2004. Both durable and nondurable goods segments participated. Construction jobs have seen persistent and significant growth, running 5.5% over the last 12 months and 6.1% during 2006.
Among service industries, there was quite a mix. Finance and professional & technical services showed good gains and transportation, retailing and accommodations & food services were all relatively strong. Areas of modest growth or outright decline included real estate, business services and administrative support. Public administration and public service sectors such as health care and education were also on the slow side.
As with many kinds of economic data, Canada's payroll employment shows mixed behavior among the components and varying movement over time. The new DLXVG3, coming out soon, will assist in the assessment of such data. In the last chart here, we show the total series excluding the unclassified enterprises. To try to diminish some of the "noise" in the monthly changes, we can calculate some trends. We start by taking a 12-month moving average in the data and then we take the average monthly change over 12-month periods. This is seen in the last graph. It is evident that job growth is much steadier now than it was in the earlier history of this survey. From early 1997 to mid-2004, a period of 90 months, there were three distinct cycles of strength and weakness in industry jobs, lasting an average of 30 months or 2-1/2 years. In the 3 years since, there has been only a bit more than half a cycle, with the uptrend showing more gradual improvement than before, but obviously lasting much longer. Over the first 5 months of this year, industry employment growth appears to be slowing, but again more gradually than in the previous cycles. It will be interesting to see way the pattern evolves in coming months.
| CANADA, Thous. | May 2007* | Apr 2007* | Dec 2006* | Year Ago | 2006 | 2005 | 2004 |
|---|---|---|---|---|---|---|---|
| Total Employees (incl Unclassified) |
14,259 | 14,252 | 14,218 | 14,019 | 14,041 | 13,702 | 13,440 |
| Average Monthly Changes | 7 | 1 | 8 (Dec to May) | 21 | 29 | 22 | 16 |
| % Change | 0.0% | 0.0% | 0.1% | 1.7% | 2.5% | 2.0% | 1.5% |
| Total ex Unclassified** | 38 | 9 | 19 | 1.9% | 2.6% | 1.5% | 0.9% |
| Goods Producing** | 19 | -12 | 0 | -0.1% | 1.4% | 0.1% | 0.0% |
| Construction** | 12 | 3 | 4 | 5.5% | 6.1% | 4.7% | 4.5% |
| Manufacturing** | 8 | -4 | -3 | -2.3% | -1.0% | -1.9% | -2.1% |
| Service Producing** | 28 | 12 | 20 | 2.4% | 2.9% | 1.9% | 1.2% |
Carol Stone, CBE
AuthorMore in Author Profile »Carol Stone, CBE came to Haver Analytics in 2003 following more than 35 years as a financial market economist at major Wall Street financial institutions, most especially Merrill Lynch and Nomura Securities. She has broad experience in analysis and forecasting of flow-of-funds accounts, the federal budget and Federal Reserve operations. At Nomura Securites, among other duties, she developed various indicator forecasting tools and edited a daily global publication produced in London and New York for readers in Tokyo. At Haver Analytics, Carol is a member of the Research Department, aiding database managers with research and documentation efforts, as well as posting commentary on select economic reports. In addition, she conducts Ways-of-the-World, a blog on economic issues for an Episcopal-Church-affiliated website, The Geranium Farm. During her career, Carol served as an officer of the Money Marketeers and the Downtown Economists Club. She has a PhD from NYU's Stern School of Business. She lives in Brooklyn, New York, and has a weekend home on Long Island.


