 Global| Mar 23 2010
Measures Of Inflation/Deflation In Taiwan
Summary
After some ten months of deflation measured by the year to year decline in the consumer price index, Taiwan has now experienced two months of inflation. In January the year to year change in the consumer price index was a small [...]
After some ten months of deflation measured by the year to year decline in the consumer price index, Taiwan has now experienced two months of inflation. In January the year to year change in the consumer price index was a small positive of 0.26%, and in February, the change was more significant at 2.35%. The deflation in the consumer price index was due largely to price declines in the prices of gas and oil. Now that the prices of fuels have resumed rising, the inflation is beginning to pick up.
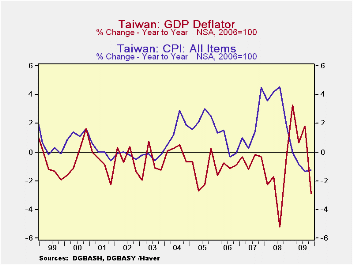
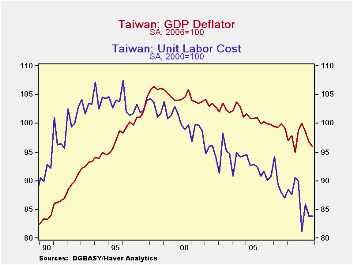
There are however, other measures of deflation/inflation--the GDP deflator for one. Year to year changes in the quarterly GDP deflator are shown in the first chart compared with the year to year changes in the quarterly consumer price index. Measured by changes in the deflator, it appears that deflation has been deeper and more persistent than that indicated by the consumer price index. The changes in the deflator are due to other changes in the economy besides commodity price changes. The most important of these "other" changes is the change in unit labor costs. The trend of unit labor costs has been negative since the mid-nineties, as can be seen in the second chart, which shows the deflator and the index of unit labor costs since 1990.
An end to Taiwan's deflation is likely to depend more on what happens to unit labor costs than what happens to commodity prices. Unit labor costs, F528ECU@EMERGEPR, Consumer Price Index, N528PC@EMERGEPR and GDP Deflator, F528NGPJ@EMERGEPR are all found in the Haver Data Base EMERGEPR.


| Feb 10 | Jan 10 | Dec 09 | Nov 09 | Oct 09 | Sep 09 | Aug 09 | Jul 09 | |
|---|---|---|---|---|---|---|---|---|
| Y/Y % Change in CPI | 2.35 | 0.26 | -0.25 | -1.62 | -1.89 | -0.88 | -0.82 | -2.33 |
| Q4/09 | Q3 09 | Q2 09 | Q1 09 | Q4 08 | Q3 08 | Q2 08 | Q1 08 | |
| Y/Y % Change in CPI | -1.26 | -1.35 | -085 | -0.01 | 1.87 | 4.52 | 4.19 | 3.58 |
| Y/Y % Change in GDP Deflator | -2.87 | 1.80 | 0.65 | 3.28 | -0.35 | -524 | -171 | -2.26 |
| GDP Deflator (2000=100) | 91.07 | 92.60 | 94.21 | 95.54 | 94.46 | -0.67 | 93.49 | 92.65 |
| Unit Labor Cost (2000=100) | 83.92 | 83.89 | 85.97 | 81.16 | 89.91 | 90.53 | 87.61 | 88.51 |
More Economy in Brief
 Global| Feb 05 2026
Charts of the Week: Balanced Policy, Resilient Data and AI Narratives
by:Andrew Cates


