 Global| Sep 17 2012
Singapore's Foreign Trade Declines Again
Summary
Singapore's exports of goods and services declined 2.43% in August and imports of goods and services were up 4.06% with the result that the favorable balance on trade in goods and services declined from S$4.7 in July to S$2.2 billion [...]
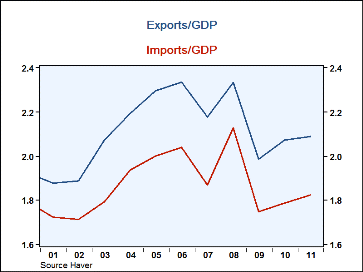
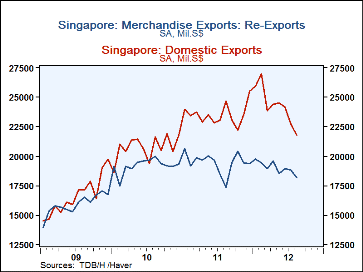
Singapore's exports of goods and services declined 2.43% in August and imports of goods and services were up 4.06% with the result that the favorable balance on trade in goods and services declined from S$4.7 in July to S$2.2 billion in August. The economy of the city state of Singapore is highly dependent on trade. Exports of goods and services are a little more than twice GDP and imports of goods and services are a little less than twice GDP, as can be seen in the first chart. In addition to its expertise in electronics, pharmaceuticals and petrochemicals, Singapore functions as a major entrepot, that is, some of its neighbors send products, particularly oil, to Singapore which is better equipped than they are for distribution to third parties. Thus a good portion of Singapore's imports are re-exported. In August, domestic exports declined 0.71% to S$22.3 billion from S$22.3 billion in July, but were 11.25% below August 2011. Re-exports declined 2.36% from 18.5 billion S$ in July to 18.1 billion S$ in August. Re-exports were, however, 1.98% above August, 2011. Domestic and re-exports are shown in the second chart.
The bright spot in domestic exports was Pharmaceuticals which increased 8.1% to S$2.11billion.in August. Exports. however, from the more important sector, Electronics, declined 8.1% in August and was 1.5% below August, 2011. Petrochemicals declined somewhat less, 2.9%, and was 1.3% above August 2011.
Because of the importance of foreign trade in the Singapore's economy its recent poor showing is not a good omen. Another quarterly decline in GDP after the second quarter decline of 1.1% would put Singapore, technically in a recession.
More Economy in Brief
 Global| Feb 05 2026
Charts of the Week: Balanced Policy, Resilient Data and AI Narratives
by:Andrew Cates


