 Global| Oct 01 2009
U.S. Construction Spending Gains in August, But June & July Revised Down
Summary
The headline sounded so promising: construction spending rose 0.8% in August, when forecasters had looked only for a 0.2% decrease. But the pleasure with this result was short-lived. July's amount was revised from -0.2% to -1.1% and [...]
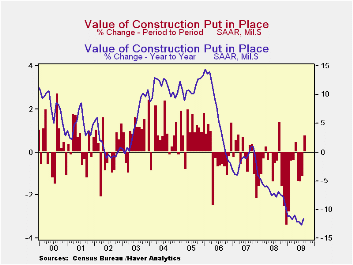 The headline sounded so promising: construction spending rose
0.8% in August, when forecasters had looked only for a 0.2% decrease.
But the pleasure with this result was short-lived. July's amount was
revised from -0.2% to -1.1% and June's from a marginal 0.1% increase to
a 1.4% fall. Some parts of the economy are improving, but much of
construction activity continues to lag. Total outlays in August were
11.6% below a year ago.
Nonresidential projects remain the weakest. Those outlays
edged down 0.1% in August, and July was revised from -1.2% to -2.6%,
while June's figure was cut back from -2.2% to -4.0%.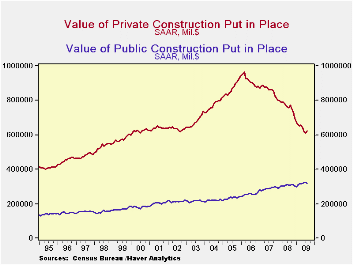 Over these last 3
months combined, nonresidential outlays dropped by 6.5%; the weakest
segments have been lodging, commercial and amusements, each down
12-15%; education (private structures), offices, transportation,
manufacturing and communication, down 5-8%, and health care, power and
religious construction activity have been flat to somewhat higher.
However, as Tom Moeller pointed out here a month ago, these declines
result mainly from poor business profits during the worst of the
recession; planning and building lead-times mean that recent work
reflects those discouraging business conditions from at least several
months ago or more. Now profits are improving and recovery in the
residential sector seems to be more firmly established. So the
implications for sustained turnaround in nonresidential construction
are much more positive now.
Public construction was down in August by 1.1%, as federal building activity fell 7.6%, while state and local government outlays decreased 0.5%. Increases over previous months mean that the year-on-year comparison still shows a gain, this of 3.3%.
| Construction (%) | August | July | June | Y/Y | 2008 | 2007 | 2006 |
|---|---|---|---|---|---|---|---|
| Total | 0.8 | -1.1 | -1.4 | -11.6 | -6.9 | -1.6 | 6.3 |
| Private | 1.8 | -1.4 | -3.2 | -17.8 | -11.1 | -5.7 | 5.5 |
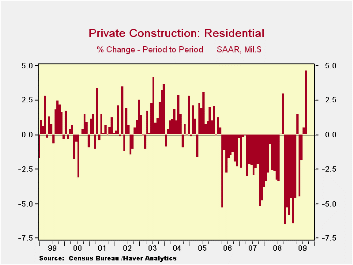
| Residential | 4.7 | 0.6 | -1.8 | -26.7 | -29.1 | -19.7 | 1.0 |
| Nonresidential | -0.1 | -2.6 | -4.0 | -10.5 | 13.2 | 23.1 | 16.2 |
| Public | -1.1 | -0.7 | 2.2 | 3.3 | 5.6 | 13.1 | 9.3 |
Carol Stone, CBE
AuthorMore in Author Profile »Carol Stone, CBE came to Haver Analytics in 2003 following more than 35 years as a financial market economist at major Wall Street financial institutions, most especially Merrill Lynch and Nomura Securities. She had broad experience in analysis and forecasting of flow-of-funds accounts, the federal budget and Federal Reserve operations. At Nomura Securities, among other duties, she developed various indicator forecasting tools and edited a daily global publication produced in London and New York for readers in Tokyo. At Haver Analytics, Carol was a member of the Research Department, aiding database managers with research and documentation efforts, as well as posting commentary on select economic reports. In addition, she conducted Ways-of-the-World, a blog on economic issues for an Episcopal-Church-affiliated website, The Geranium Farm. During her career, Carol served as an officer of the Money Marketeers and the Downtown Economists Club. She had a PhD from NYU's Stern School of Business. She lived in Brooklyn, New York, and had a weekend home on Long Island.


