 Global| Aug 21 2008
U.S. Initial Jobless Claims Ease for a Second Week; Supplemental Program Reaches 1.3 Million
Summary
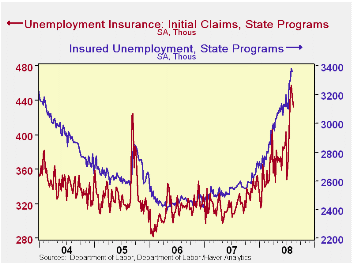
Initial claims for unemployment insurance fell last week to 432,000 from 445,000 during the prior week. Consensus expectations had envisioned a slightly smaller decrease. Claims for both last week and the week before were revised [...]

Initial claims for unemployment insurance fell last week to 432,000 from 445,000 during the prior week. Consensus expectations had envisioned a slightly smaller decrease. Claims for both last week and the week before were revised downward marginally. The four-week moving average increased to 444,750 (39.3% y/y).
Continuing claims for unemployment insurance edged down 17,000
during the latest week, after increasing 77,000 the week before, which
also reflects a slight downward revision. The total number of
recipients was 3,362,000; this represented 2.5% of covered employment.
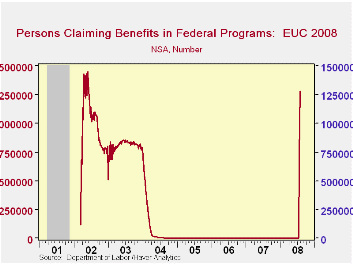
This report included data for a second week of the recently enacted "Emergency Unemployment Compensation" program, a federally funded effort targeting people who have exhausted all other unemployment insurance programs. There were 1,284,252 recipients in the week ended August 2, following 713,968 the prior week. Thus, while the regular state programs showed some reductions among newer beneficiaries, this supplemental program has obviously found a reservoir of necessitous individuals who have been unemployed for quite some time. This is about the same magnitude so far as the number of beneficiaries of a similar temporary program initiated in 2002.
| Unemployment Insurance (000s) | 08/16/08 | 08/09/08 | 08/02/08 | Y/Y | 2007 | 2006 | 2005 |
|---|---|---|---|---|---|---|---|
| Initial Claims | 432 | 445 | 457 | 32.5% | 322 | 313 | 331 |
| Continuing Claims | -- | 3,362 | 3,379 | 30.9% | 2,552 | 2,459 | 2,662 |
by Robert BruscaAugust 21, 2008

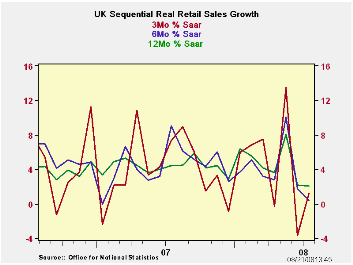
UK retail sales showed a sharp bump up in May of this year.
Since that time it has been all downhill for the three major trends in
retail sales: 3-mo, 6-mo and Yr/yr. The trends generally display a
progressive deterioration in the pace of sales.
Over three-months there is a slight uptick in these
deteriorating trends and one that spreads across the main growths we
display in the table. Even real retail sales ex- autos show some lift.
But retail sales are volatile and vagaries of weather and calendar can
imbue a month with unexpected results. If we take the growth in July
annualized over the level of sales Q2 we find that quarter-to-date
sales are not just losing momentum but declining. The bump up in July
was not enough to offset the sharp weakness experienced in June. That
suggests that the June/July period taken together is a better barometer
of sales trends.
| UK Real and Nominal Retail Sales | ||||||||
|---|---|---|---|---|---|---|---|---|
| Nominal | Jul-08 | Jun-08 | May-08 | 3-MO | 6-MO | 12-MO | YrAGo | Quarter-2-date |
| Retail Total | 1.0% | -3.9% | 4.2% | 4.6% | 3.2% | 3.6% | 3.2% | -1.8% |
| Food Beverages & Tobacco | 1.2% | -3.2% | 4.3% | 9.0% | 5.3% | 6.8% | 0.6% | 2.6% |
| Clothing Footwear | 2.2% | -7.7% | 9.5% | 14.2% | 1.9% | 1.7% | 1.5% | -1.0% |
| Real | ||||||||
| Retail Ex Auto | 0.8% | -4.3% | 4.0% | 1.2% | 0.4% | 2.0% | 4.4% | -5.0% |
by Robert Brusca August 21, 2008

But has Europe already been flattened?
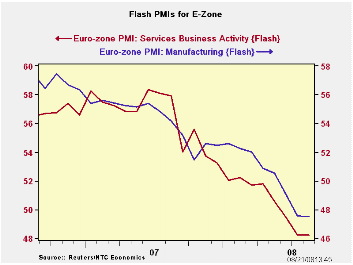
The services and MFG PMIs (form NTC/Markit) for EMU flattened
out this month falling month-to-month but barely falling. As a result
the services and MFG PMIs are at the bottom of their recent ranges
dating back to January 2006. For MFG indices stretch back to 1998 and
in that broader range their current reading resides in the 26th
percentile, nearly the bottom quartile. But by count MFG PMIs have been
weaker than this value only 6% of the time. So while the weakest
reading is a lot lower MFG PMIs are rarely lower than they are now.
The MFG reading is the more interesting of the two since it
spans a longer time horizon. The services index is still relatively new
and untested in a Biz cycle. Still the two indices together paint a
weakening picture of the Zone. One unanswered question is how much the
recent drop in oil prices will breathe new life into fading sectors. It
is still too soon to tell, although German financial experts who were
respondents to the Zew survey seem encouraged.
| FLASH Readings | ||
|---|---|---|
| Markit PMIs for the E-Zone-13 | ||
| MFG | Services | |
| Aug-08 | 47.49 | 48.23 |
| Jul-08 | 47.54 | 48.26 |
| Jun-08 | 49.07 | 49.46 |
| May-08 | 50.52 | 50.59 |
| Averages | ||
| 3-Mo | 48.03 | 48.65 |
| 6-Mo | 49.58 | 50.00 |
| 12-Mo | 51.01 | 51.74 |
| 31-Mo Range | ||
| High | 57.61 | 61.21 |
| Low | 47.49 | 48.23 |
| % Range | 0.0% | 0.0% |
Carol Stone, CBE
AuthorMore in Author Profile »Carol Stone, CBE came to Haver Analytics in 2003 following more than 35 years as a financial market economist at major Wall Street financial institutions, most especially Merrill Lynch and Nomura Securities. She had broad experience in analysis and forecasting of flow-of-funds accounts, the federal budget and Federal Reserve operations. At Nomura Securities, among other duties, she developed various indicator forecasting tools and edited a daily global publication produced in London and New York for readers in Tokyo. At Haver Analytics, Carol was a member of the Research Department, aiding database managers with research and documentation efforts, as well as posting commentary on select economic reports. In addition, she conducted Ways-of-the-World, a blog on economic issues for an Episcopal-Church-affiliated website, The Geranium Farm. During her career, Carol served as an officer of the Money Marketeers and the Downtown Economists Club. She had a PhD from NYU's Stern School of Business. She lived in Brooklyn, New York, and had a weekend home on Long Island.
More Economy in Brief
 Global| Feb 05 2026
Charts of the Week: Balanced Policy, Resilient Data and AI Narratives
by:Andrew Cates


