 Global| Dec 30 2015
U.S. Pending Home Sales Decline in November
Summary
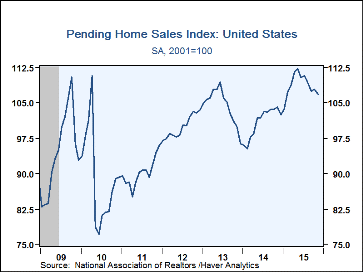
The National Association of Realtors (NAR) reported that pending sales of single-family homes fell 0.9% in November (+5.1% y/y) following October's 0.4% rise, which was initially reported as 0.2%. The November sales volume is 4.8% [...]
The National Association of Realtors (NAR) reported that pending sales of single-family homes fell 0.9% in November (+5.1% y/y) following October's 0.4% rise, which was initially reported as 0.2%. The November sales volume is 4.8% below their peak in May. Expectations, according to a Bloomberg survey, were for an increase of 0.7%. These sales are reported as an index with 2001=100. The November value of 106.9 was up 38.7% from the June 2010 low.
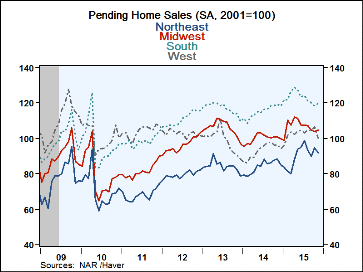
Regionally, November sales were mixed and reversed their pattern of October. Sales in the Northeast and West had increased in October, and they declined in November, while the reverse was true in the Midwest and South. Back in September, sales had fallen in all four regions. For November, sales in the Northeast fell 3.0% (+8.0% y/y), after a 5.6% gain in October. In the West, they fell 5.5% (+8.5% y/y) after October's 1.7% rise. In contrast, sales in the Midwest rose 1.0% in November, exactly reversing a 1.0% decline in October. And in the South, they rose 1.3% after decreasing 1.4%.
The pending home sales figures are analogous to the new home sales data from the Census Bureau. They measure home sales when the sales contract is signed, not at the time the sale is closed. In developing the model for the index, the NAR demonstrated that the level of monthly sales contract activity parallels the level of closed existing home sales in the following two months. The series dates back to 2001 and the data are available in Haver's PREALTOR database.
| Pending Home Sales (%, SA) | Nov | Oct | Sep | Nov Y/Y (NSA) | 2014 | 2013 | 2012 |
|---|---|---|---|---|---|---|---|
| Total | -0.9 | 0.4 | -1.6 | 5.1 | -4.4 | 5.0 | 11.8 |
| Northeast | -3.0 | 5.6 | -4.0 | 8.0 | -1.4 | 7.0 | 17.6 |
| Midwest | 1.0 | -1.0 | -2.3 | 7.2 | -6.3 | 11.3 | 18.6 |
| South | 1.3 | -1.4 | -1.1 | 1.3 | -2.0 | 6.0 | 12.9 |
| West | -5.5 | 1.7 | -0.2 | 8.5 | -8.7 | -3.8 | 1.5 |
Carol Stone, CBE
AuthorMore in Author Profile »Carol Stone, CBE came to Haver Analytics in 2003 following more than 35 years as a financial market economist at major Wall Street financial institutions, most especially Merrill Lynch and Nomura Securities. She has broad experience in analysis and forecasting of flow-of-funds accounts, the federal budget and Federal Reserve operations. At Nomura Securites, among other duties, she developed various indicator forecasting tools and edited a daily global publication produced in London and New York for readers in Tokyo. At Haver Analytics, Carol is a member of the Research Department, aiding database managers with research and documentation efforts, as well as posting commentary on select economic reports. In addition, she conducts Ways-of-the-World, a blog on economic issues for an Episcopal-Church-affiliated website, The Geranium Farm. During her career, Carol served as an officer of the Money Marketeers and the Downtown Economists Club. She has a PhD from NYU's Stern School of Business. She lives in Brooklyn, New York, and has a weekend home on Long Island.


