 Global| Mar 05 2007
World Stock Markets
Summary
The 9% decline in the Chinese stock market last Wednesday was followed by a good deal of turmoil in most of the stock markets of world. There were smaller declines in most other countries and some recoveries later in the week in China [...]

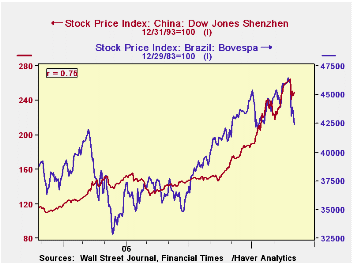
The 9% decline in the Chinese stock market last Wednesday was followed by a good deal of turmoil in most of the stock markets of world. There were smaller declines in most other countries and some recoveries later in the week in China and elsewhere. However, in some cases, Brazil for example, the decline continued and by Friday of last week, the Brazilian stock market was 8.3% below the February 26 peak, while the Chinese market had recovered a bit and was 5.8% below its February 26 peak. The first chart compares the daily stock prices in China and Brazil.
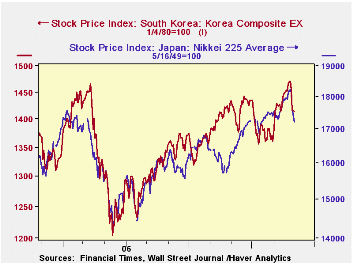
By Friday of last week, the stock markets in India and Japan were down 5.6% and 5.5% respectively, but the market in South Korea was down only 3.8%. The stock markets in South Korea and Japan are shown in the second chart.
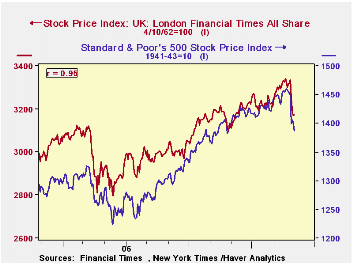
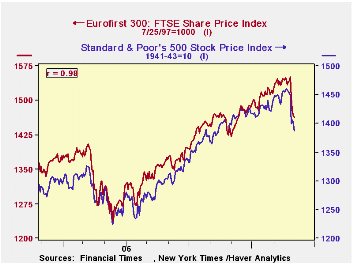
Markets in the United State, United Kingdom and in the Euro Area are highly correlated as can be seen in the third and fourth charts. By Friday, the FTSE Eurozone 300 index was down 5.8%, while the U. K. FTSE All shares was down 4.9% and the U. S. Standard and Poor's 500 was down 4.29%
The above charts show only a few of the many stock markets indexes that Haver carries. The most up to date data are in the DAILY, INTDAILY and MSCID (Morgan Stanley Capital International ). There are also up to date weekly data in the WEEKLY, INTWKLY and MSCIW. National indexes are also given in the country sourced data.

| STOCK MARKET INDEXES | 2/26/07 | 2/27/07 | 2/28/07 | 3/2/07 | 2/26-2/27 % | 2/26-3/2 % |
|---|---|---|---|---|---|---|
| China Dow Jones Chenzhen (12/31/93=100) | 264.5 | 241.3 | 250.62 | 248.96 | -8.77 | -5.88 |
| Japan Nikkei 225 (5/16/49=100) | 18215 | 18120 | 17604 | 17218 | -0.52 | -5.48 |
| India Bombay Sensex (1979=100) | 13650 | 13479 | 12938 | 12886 | -1.25 | -5.59 |
| South Korea Composite (1/4/80=100) | 1470.0 | 1454.6 | 1417.3 | 1414.5 | --1.05 | -3.78 |
| Brazil Bovespa (12/29/83=100) | 46207 | 43145 | 43892 | 42670 | -6.63 | -8.31 |
| FTSE Euro Zone 300 (7/29/97=100) | 1692.7 | 1643.2 | 1620.7 | 1594.0 | -2.92 | -5.83 |
| FTSE U K All Shares (4/10/62=100) | 3336.2 | 3252.3 | 3198.3 | 3172.3 | -2.51 | -4.91 |
| S&P 500 (41-43=100) | 1449.4 | 1399.0 | 1406.8 | 1387.2 | -3.47 | -4.29 |
More Economy in Brief
 Global| Feb 05 2026
Charts of the Week: Balanced Policy, Resilient Data and AI Narratives
by:Andrew Cates


