 Global| Dec 22 2020
Festivus 2020 – I Got a Lot of Problems with You People
|in:Viewpoints
Summary
It is almost December 23rd and that means that Festivus is almost upon us. It is traditional on Festivus to air one's grievances. And this Festivus, I got a lot of problems with you people. My problems with you include the so-called [...]
It is almost December 23rd and that means that Festivus is almost upon us. It is traditional on Festivus to air one's grievances. And this Festivus, I got a lot of problems with you people. My problems with you include the so-called covid "stimulus", the soaring US federal debt, Brexit, student loan debt, stagnant workers' real earnings, "data" and "honing in".
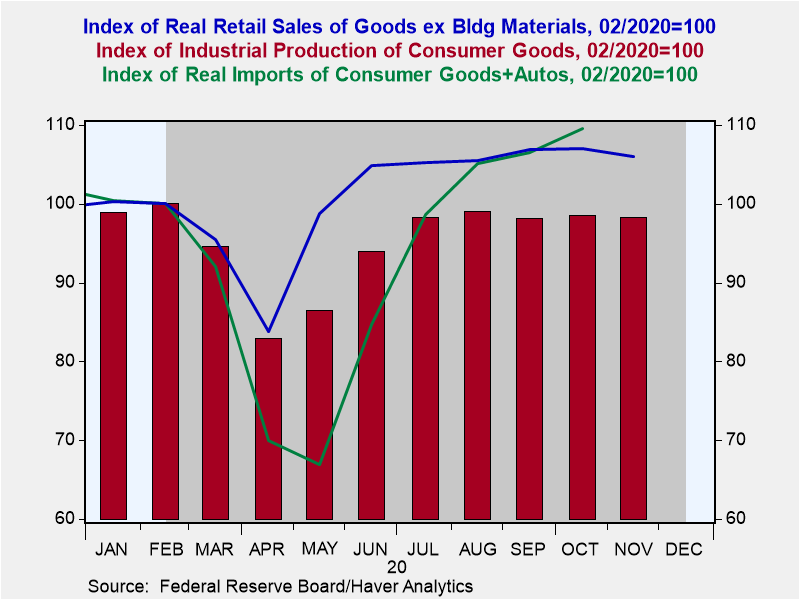
Let's get started with the covid "stimulus". The main thing covid-related federal payments to households stimulated was imported consumer goods. Plotted in Chart 1 are monthly observations of CPI-adjusted retail sales of goods excluding building materials, industrial production of consumer goods including motor vehicles and real imports of combined consumer goods and autos. All of these series have been converted to index with a value of 100 in February 2020. Real retail sales (the blue line) have fully recovered from their spring covid swoon. As of this November, they were 6% above their February 2020 level. But the domestic production of consumer goods (the red bars) this November was about 2% below the February 2020 level. If real consumer spending on goods is rising relative to the domestic production of them, the difference has to be made up by either an increase in real imports of consumer goods or declines in the inventories of real consumer goods. As of October, the latest data available, real imports of consumer goods (the green line) were 9-1/2% above their February 2020 level. Real retail inventories of consumer goods, (not shown in the graph) in October were down by almost 8-3/4% from February 2020. Because covid represented a supply shock to the US economy, the federal "gift" of Fed-printed money to households stimulated foreign economies more than the US economy in terms of production.
Chart 1
I have a grievance with the use of the word "stimulus" in connection with the covid-related transfer payments to US households and businesses. Again, covid represented primarily a negative supply shock to the US economy. People could not go to work because of covid. People chose not to patronize certain businesses because of covid. So, the US economy crashed into recession because of a lack of supply, not demand. But regardless of the cause of the recession, households lost income and businesses lost profits. They needed "relief" to compensate for their covid-related income/profit losses. Without this relief, some households would not have been able to meet their nondiscretionary expenses such as food and shelter. This leads me to the core of my grievance regarding "stimulus". As part of the original covid relief program and part of the second program were/are checks cut to households regardless of whether they suffered any loss of income due to covid. Before covid hit, the US federal fiscal situation was on a precarious path (more on this in another grievance). Issuing checks to households that have not experienced covid-related income losses just exacerbates the coming precarious fiscal situation. I don't want to let the good be the enemy of the perfect, but if we believe that some households with annual incomes below $100,000 should have their incomes topped up, regardless of covid, then let's have Congress pass a permanent plan to address this and raise taxes on those of us with incomes above this threshold to pay for it.
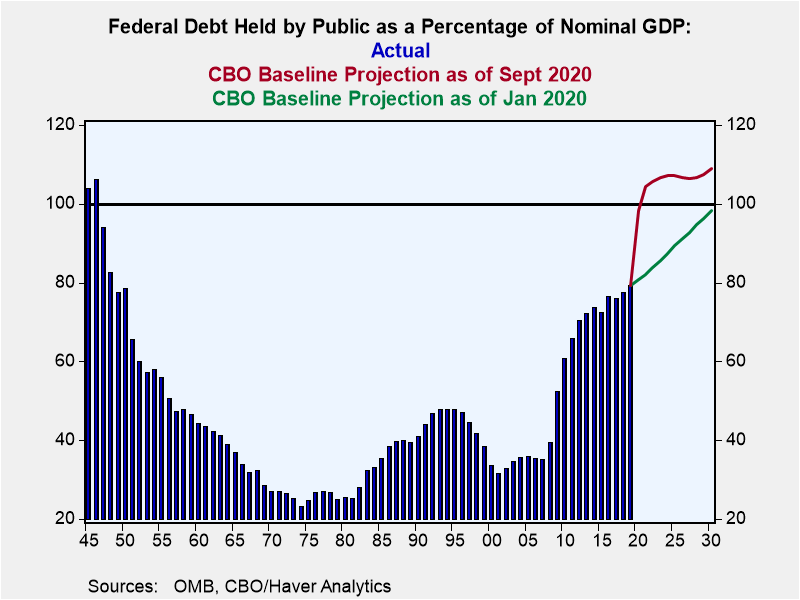
My next grievance has to do with the deteriorating federal fiscal outlook. Plotted in Chart 2 are the fiscal-year observations of publicly-held federal debt as a percent of nominal GDP – actual and projected by the CBO. There are two CBO projections plotted. The first one is the CBO baseline projection made in January of this year, pre-covid (the green line). The second projection was made in September of this year, during covid (the red line). The record high ratio of federal debt held by the public as a percent of nominal GDP occurred in Fiscal Year (FY) 1946 at 106.1%. At the end of FY 2020, this ratio was 100.3% (not shown in Chart 2). Prior to covid, the CBO was projecting that the debt-to-GDP ratio would continue to trend higher, reaching 98.3% by 2030, the highest ratio reading since 1946. In September, after covid was upon us and the first round of covid-relief spending had occurred, the CBO projected that the debt-to-GDP ratio would match the 1946 high of 106% by FY 2023 and reach almost 109% in FY 2030. I can hardly wait for the CBO’s updated forecast following the latest additional $900 billion covid-related relief program.
Chart 2
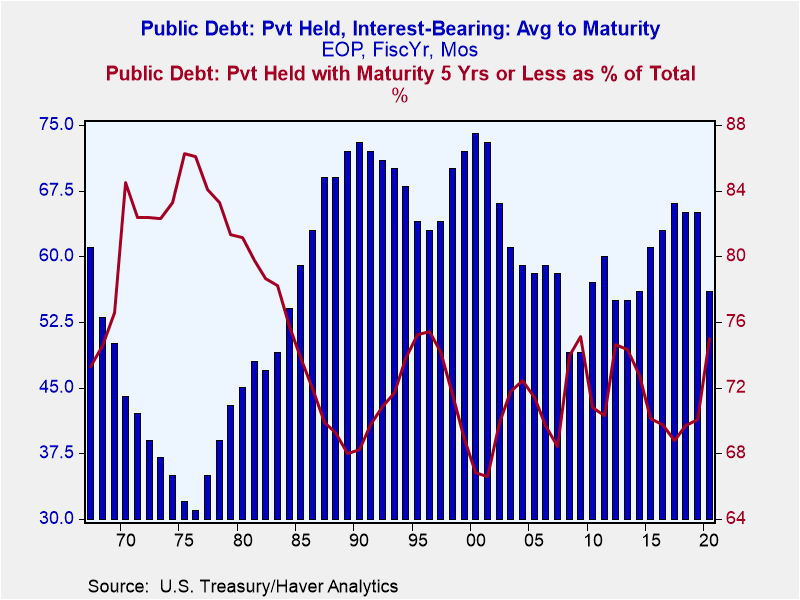
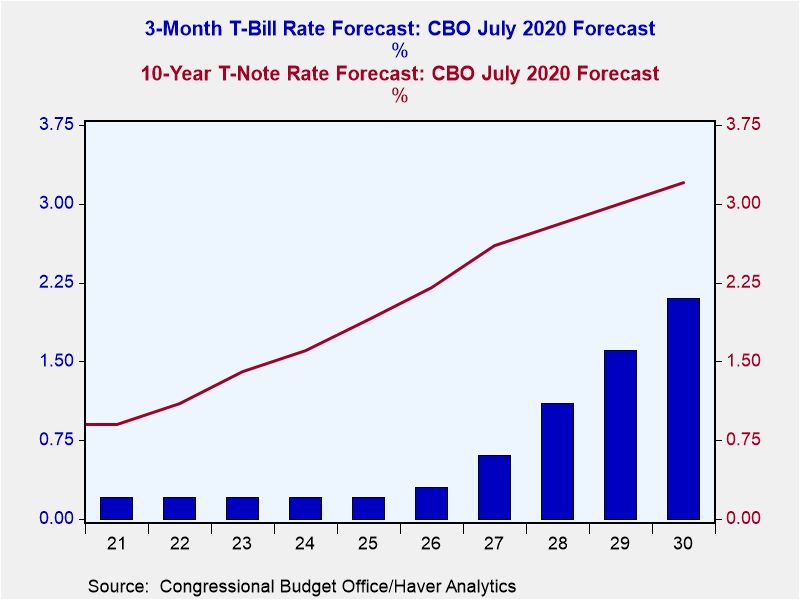
One of the standard responses to my grievance that our fiscal house is in disorder is that interest rates are low, even negative when adjusted for consumer price inflation. So, relax, Paul. The cost of servicing this explosion in debt is low. I would take more comfort in this response if the Treasury were locking in these low current interest rate levels as households are doing with their mortgages. But unlike households, the Treasury has reduced the maturity of its debt. Plotted in Chart 3 are fiscal year observations of the average maturity in months of publicly-held Treasury debt (the blue bars) and the percent of total publicly-held Treasury debt of five-years and less maturity. After reaching an average maturity of 66 months in 2017, the average maturity of publicly-held Treasury debt fell to 56 months in 2020. Similarly, with the percentage of publicly-held Treasury debt with a maturity of five years or less falling to 68.8% in 2017, this percentage has risen to 75.0% in 2020. So, depending on how much interest rates rise in the future, the Treasury's debt-servicing costs will rise on its outstanding debt, not to mention on its increasing debt. Chart 4 shows the CBO's July forecast for the interest rates on three-month Treasury bills and 10-year Treasury bonds. The CBO sees T-bill rates steady at 0.2% through 2025 and rising ever so slightly to 0.3% in 2026. Regarding the 10-year Treasury bond rate, the CBO sees it rising to 1.9% by 2025, a mere 100 basis points higher than where it is now. My suspicion is that this CBO interest rate forecast is too low. If I am right about this, then the CBO's forecast of federal debt-servicing expenses also is too low.
Chart 3 Chart 4
If you have a sharp eye, you will see in Chart 2 that the federal debt as a percent of nominal GDP hit a post-WWII low of about 23% in 1974. Relatively strong growth in real GDP was an important factor in bringing down this percentage from its 1946 high of 106%. In the period from 1946 through 1974, the median year-over-year growth in real GDP was 4.1%. In July, the CBO projected that the median growth in real GDP in the period from 2021 through 2030 would be 2.3%. Given that the projected median year-over-year growth in population aged 15- to 64-years old, roughly the labor force, is 0.2% from 2021 through 2030 versus actual median growth of 1.5% from 1946 through 1974, it would be reasonable to expect slower real GDP growth going forward compared with the 1946 through 1974 period. Thus, it does not appear as though faster real GDP growth will be a factor to help bring down the ratio of publicly-held federal debt-to-nominal GDP.
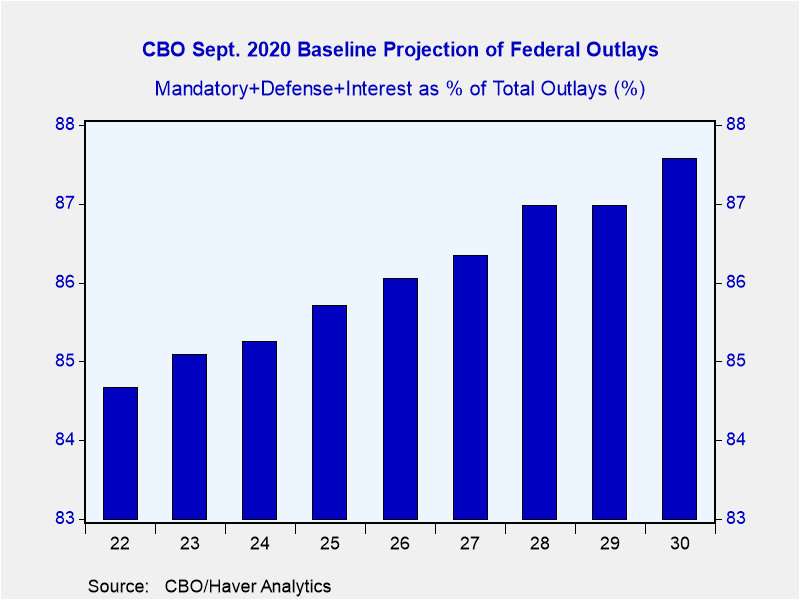
Perhaps growth federal spending in the next 10 years will be slower than what the CBO is projecting? Not bloody likely! Plotted in Chart 5 are annual CBO baseline projections of the sum of mandatory federal outlays, defense outlays and net interest outlays as a percent of total outlays for FY 2022 through FY 2030, the median value of which is about 86%. Over this same period, the median value of the sum of Social Security, Medicare, Medicaid, SNAP (food stamps) and civilian/military retirement outlays as a percent of total mandatory outlays is projected to be about 94%. So, you tell me where it will be politically feasible to slow down the growth in federal spending where 86% of the total outlays is projected to come from mandatory programs, defense and interest.
Chart 5
What about raising taxes? Not a snowball's chance in hell unless the Democrats win both Georgia Senate seats in the January 5, 2021 election. And even if the Democrats were to have a slim majority in the Senate to go along with their slim majority in the House, their ability to raise taxes meaningfully would be politically circumscribed.
Perhaps this time is different. Perhaps an ever-rising ratio of government debt-to-nominal GDP is of no concern to domestic and global investors. History suggests differently. Why isn't the British pound still the global reserve currency? My bet is that the US federal debt-to-nominal GDP ratio will be brought down via high enough inflation to cause nominal GDP to grow faster than the debt.
Speaking of the British, I have a grievance with this drawn out Brexit drama. Perhaps Northern Ireland is a complicating factor, but I don't know why the British don't follow the lead of their deceased experts on this matter, Adam Smith and David Ricardo. These guys explained that the gains from trade were associated with imports, not exports. Exports are what you have to give up to obtain imports. The British repealed the Corn Laws (tariffs on imported grain) in 1846. They should take a lesson from this and declare that all import tariffs will be eliminated. If other countries, including those of the EU, want to impose tariffs on UK goods and services and thereby harm their own citizens, that is their prerogative. If the UK were to eliminate all tariffs on imported goods, its economy would be on the way to achieving the success one of its former colonies, Hong Kong, did.
Okay, back to the home front – student loans. The outstanding amount of student loans is about $1.7 trillion, 80% of which are owned by the federal government. I have great sympathy for some kind of policy to lower the debt burden on former students, not necessarily blanket forgiveness. The reason for my sympathy is that the generations saddled with student debt are the same generations that will be saddled with the debt that is being generated to take care of my generation in the form of Social Security and Medicare transfer payments. So, my sympathy to reduce the burden of student debt is based on intergenerational equity, not economics. One of the arguments being made to reduce the burden of student debt is that it will "stimulate" economic activity by putting more money in the hands of these former students. First of all, it will not put lump sums in the hands of these former students. Rather it will reduce their monthly payments. But that's not the real issue. Where does this extra money come from to give to these former students? Unless the Fed prints it, the money is coming from the creditors of student debt. As I mentioned above, the federal government owns about 80% of the outstanding student debt. Every dollar of debt forgiveness a student gets is a dollar less of revenues the government receives. If the government cuts spending, then someone else experiences a decline in his spendable funds. If the government raises taxes to make up for its revenue shortfall from the forgiveness of student debt, then someone else has to cut his spending to pay the higher taxes. If the government issues more debt to compensate for its loss of revenues, then someone lends to the government at the expense of lending to some private entity. The upshot is that some sort of student-debt forgiveness does not lead to a net increase in aggregate spending (unless the Fed prints the money), but rather just changes who is doing the same amount of aggregate spending. Approximately the same amount of aggregate spending occurs. It's just different people/entities doing the spending.
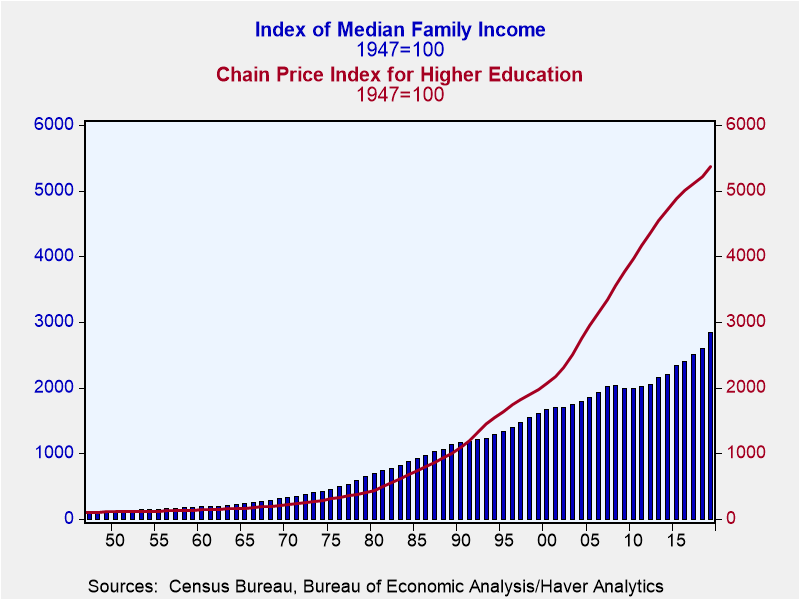
I have sympathy for prior generations saddled with high levels of student debt not only because my generation is "bequeathing" them with high levels of other federal debt, but because the cost of higher education has far outpaced median family incomes starting in the 1990s, as shown in Chart 6. Why has the cost of higher education risen so much relative to median family incomes in the past three decades? Part of it is because of the ease with which student loans can be obtained. This has resulted in an increased effective demand for higher education. The providers of higher education can raise their prices knowing that the government will lend extra amounts to the unsophisticated and naïve student borrower. Kind of a vicious cycle. Part of it may be related to more people seeking advanced degrees such as LLBs or MBAs. I have some other ideas as to why the cost of higher education has accelerated relative to median family incomes in recent decades. But if I get started on them, it would just be the rants of the old man that I am. I'll save old-man rants for the end of this epistle.
Chart 6
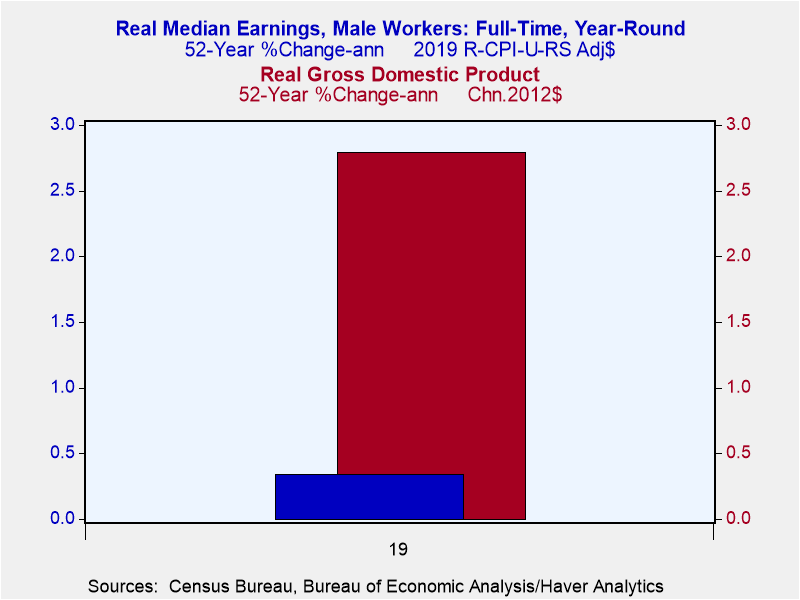
Just as I have sympathy for many former students burdened by massive higher-education debt, I also have sympathy for workers who have seen their real wages remain stagnant for decades. Chart 7 shows that the compound annualized growth in the median real wages of full-time male workers has been a scant 0.34% in the 52 years ended 2019. In this same period, the compound annualized growth in real GDP has been 2.79%. I do not think that this near stagnation in real earnings is cause for concern in a macroeconomic sense. Rather, I think it is a cause for concern in a political sense. When large parts of a civil society experience a stagnant standard of living for decades, incivility can set in. Some argue that a solution for this festering problem is an increase in the minimum wage. If I believe that it is in the public interest that some working people have a higher standard of living, why should not the public, that is, the taxpayers in the aggregate, "top up'" the earnings of this group of workers? Why should the stockholders and customers of firms not paying a "living wage" bear all of the costs? A rational employer pays its employees the least amount necessary to retain employees. A rational employer does not pay an employee more than the revenue that employee can generate. Capitalism is efficient in allocating resources in a way to maximize output. Capitalism is not "fair". If our society, for various reasons, believes that it is only fair that workers at McDonald's should earn more than they are being paid, then let's expand and enhance the Earned Income Tax Credit (EITC) so that it encourages people to get the best job they currently can and then collectively boost their incomes to some society-agreed on level. If it is not already, the EITC should be structured such that as a worker's salary increases, he is not penalized 100% for his salary increase in terms of lost tax credits. This creates incentives for the worker to seek higher value-added employment. Milton Friedman, who proposed a negative income tax, the forerunner of the EITC, allegedly said that if you care about low-income people, give them money. If we care about low-income working people, let's give them more money via the EITC and help pay for it by phasing out government-administered in-kind payments such as food stamps and rent subsidies. An enhanced EITC is bound to cost the taxpayers less to administer than food stamps and rent subsidies.
Chart 7
I will finish with an old man's rant, as promised. Data are plural. Datum is singular. It's the curse of having taken high school Latin that leads me to be such a petty pedant on this. We don't "hone in" on something any more than we have "honing" pigeons. We home in on things and we hone our skills.
Well, I have brought the aluminum Festivus pole up from the basement. It is made of aluminum because of its high strength-to-weight ratio. And the clock in the bag is hung on the wall. Why is clock in a bag hung on a wall? No one really knows. It's just an ancient Festivus tradition. So, it is time to gather around the pole, lift a glass of single-malt Scotch and join in the singing of "O Festivus". Remember, Festivus is not over until you pin me.
O' Festivus
Lyrics by Katy Kasriel
To the melody of O' Tannenbaum
O' Festivus, O' Festivus,
This one's for all the rest of us.
The worst of us, the best of us,
The shabby and well-dressed of us.
We gather ‘round the ‘luminum pole,
Air grievances that bare the soul.
No slights too small to be expressed,
It's good to get things off our chest.
It's time now for the wrestling tests,
Feel free to pin both kin and guests,
O'Festivus, O' Festivus,
The holiday for the rest of us.
And a contentious Festivus 2020 to all.
Paul L. Kasriel
AuthorMore in Author Profile »Mr. Kasriel is founder of Econtrarian, LLC, an economic-analysis consulting firm. Paul’s economic commentaries can be read on his blog, The Econtrarian. After 25 years of employment at The Northern Trust Company of Chicago, Paul retired from the chief economist position at the end of April 2012. Prior to joining The Northern Trust Company in August 1986, Paul was on the official staff of the Federal Reserve Bank of Chicago in the economic research department. Paul is a recipient of the annual Lawrence R. Klein award for the most accurate economic forecast over a four-year period among the approximately 50 participants in the Blue Chip Economic Indicators forecast survey. In January 2009, both The Wall Street Journal and Forbes cited Paul as one of the few economists who identified early on the formation of the housing bubble and the economic and financial market havoc that would ensue after the bubble inevitably burst. Under Paul’s leadership, The Northern Trust’s economic website was ranked in the top ten “most interesting” by The Wall Street Journal. Paul is the co-author of a book entitled Seven Indicators That Move Markets (McGraw-Hill, 2002). Paul resides on the beautiful peninsula of Door County, Wisconsin where he sails his salty 1967 Pearson Commander 26, sings in a community choir and struggles to learn how to play the bass guitar (actually the bass ukulele). Paul can be contacted by email at econtrarian@gmail.com or by telephone at 1-920-559-0375.


