 Global| Jun 28 2021
Six Lessons from 2021 H1
by:Andrew Cates
|in:Viewpoints
Summary
As we head into the second half of 2021, here are a few exhibits that offer some colour on what we have learned about the global environment in the first half of this year. Vaccines are working The first lesson is that vaccines are [...]
As we head into the second half of 2021, here are a few exhibits that offer some colour on what we have learned about the global environment in the first half of this year.
Vaccines are working
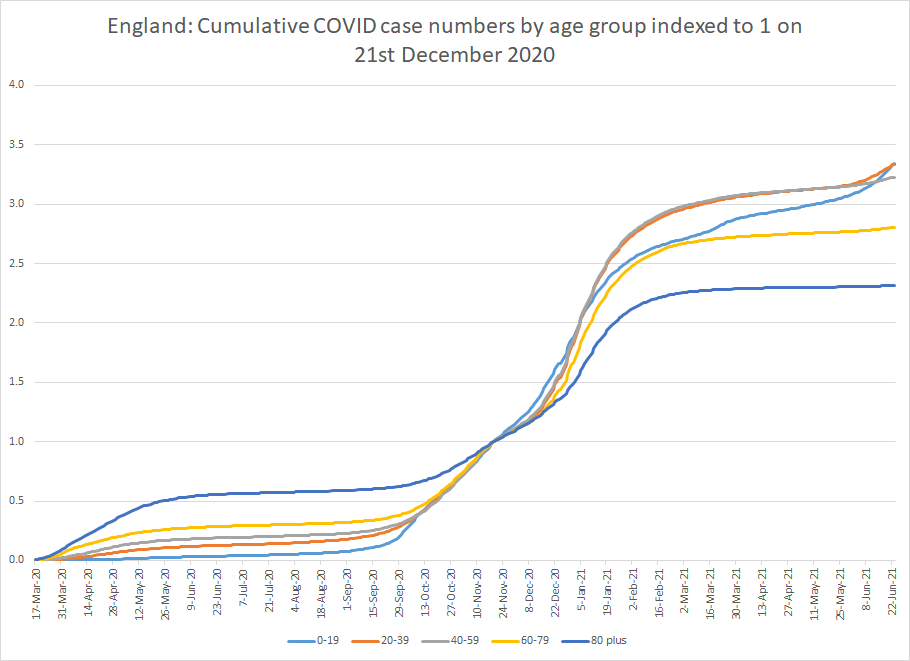
The first lesson is that vaccines are working. Figure 1 below shows cumulative COVID case numbers by age group in England indexed to the point at which the UK vaccination effort began in earnest (21st December 2020). The figure reveals a very sharp slowdown in those age cohorts that have so far been vaccinated heavily (i.e. the elderly) relative to those cohorts that have not (i.e. the young). The most striking feature of this chart is the degree to which case numbers in elderly age cohorts have remained relatively stable in recent weeks as the so-called Delta variant has taken hold in the UK. This contrasts with the younger age cohorts which have seen sharply rising case numbers. Broader hospitalisation trends and fatalities have – as a consequence of this – not risen that much.
Figure 1: Cumulative COVID case numbers by age group in England
Source: NHS England, Haver Analytics
Vaccines matter for economic performance
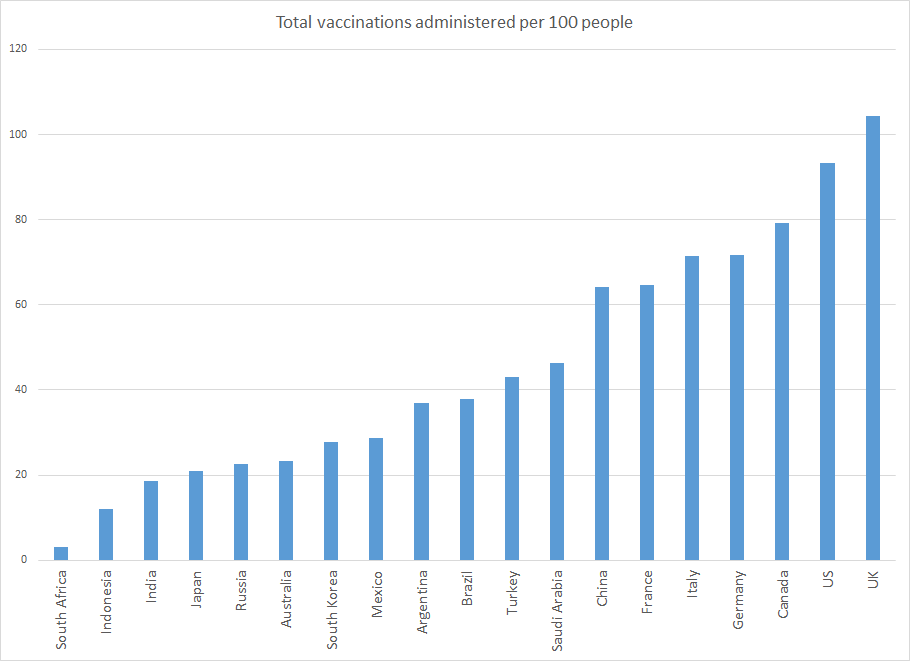
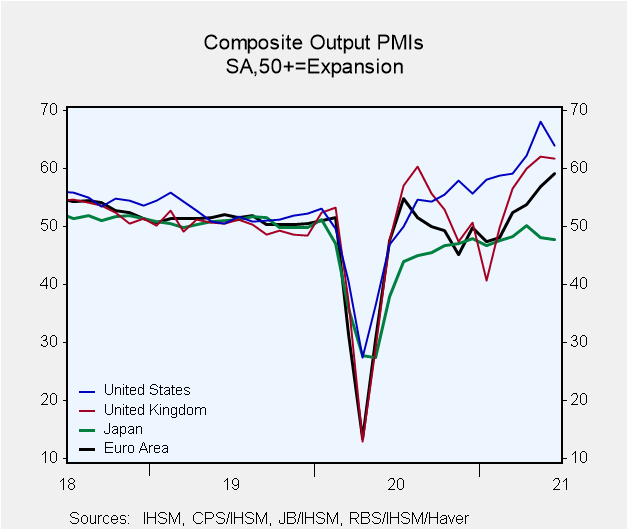
The second lesson – a clear product of the first - is that vaccines clearly now matter for economic performance. A comparison of vaccination rates in the G20 nations reveals that the US and UK are some way ahead now of progress in many other major economies (see figure 2 below). And this is understandably generating varying response rates from consumer and business confidence. Even more importantly, it is allowing US - and to a lesser extent - UK policymakers to ease lockdown restrictions and accordingly to free up slices of economic activity. The latest set of flash purchasing managers surveys for June echo these considerations in revealing relative strength in the US and UK compared with, say, Japan (see figure 3 below).
Figure 2: Vaccinations rates in the G20
Source: University of Oxford, Haver Analytics
Figure 3: Composite PMI balances in the US, UK, Japan and Euro Area
Supply chain congestion is causing inflation tension
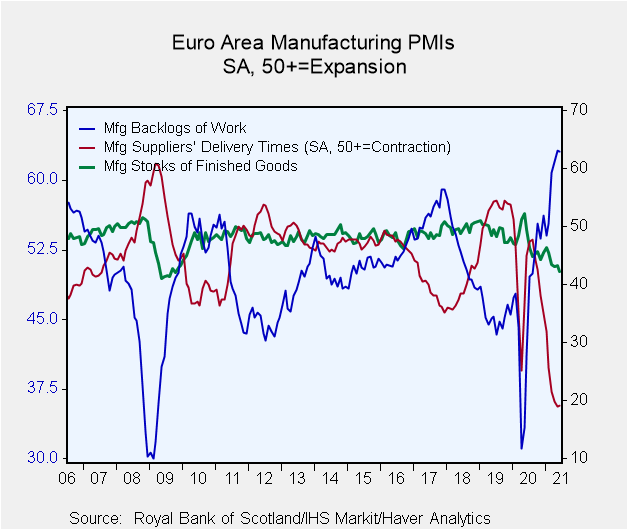
The third lesson concerns inflation. Price pressures have been building in a number of economies in recent months and economic forecasters – particularly in the US – have been lifting their CPI forecasts. This, in turn, can be traced to a number of considerations including the venting of pent-up demand as economies have re-opened. But supply chain congestion has been a big factor too. Lengthening delivery times, rising backlogs of work and depleted levels of finished inventory have been hallmarks of global manufacturing activity in recent months, for example, as evidenced for the Euro Area in figure 4 below. How and when these bottlenecks are resolved will play a key role in the evolution of the world economy in the second half of this year.
Figure 4: Evidence of supply chain bottlenecks in the Euro Area from PMI surveys
Capex and productivity are responding
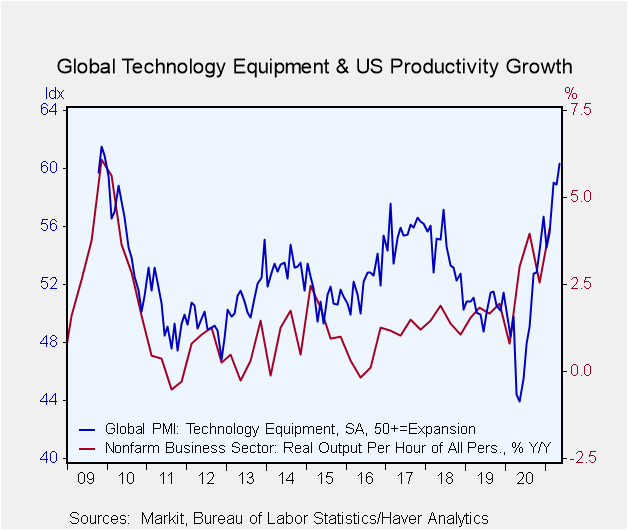
The fourth lesson, however, is that companies appear to be responding to these bottlenecks. Surveys of capex intentions and incoming data on capital goods orders and productivity from some economies suggest that firms are seeking to expand capacity, to deploy new technology and to marshal productivity gains (see figure 5 below). In the December Duke CFO Survey from the US, roughly one-half of chief financial officers from large firms and about one-third of those from small firms reported "using, or planning to use, automation or technology” to boost productivity.
Figure 5: US productivity growth may be responding to firming investment demand
Higher inflation is generating negative growth surprises
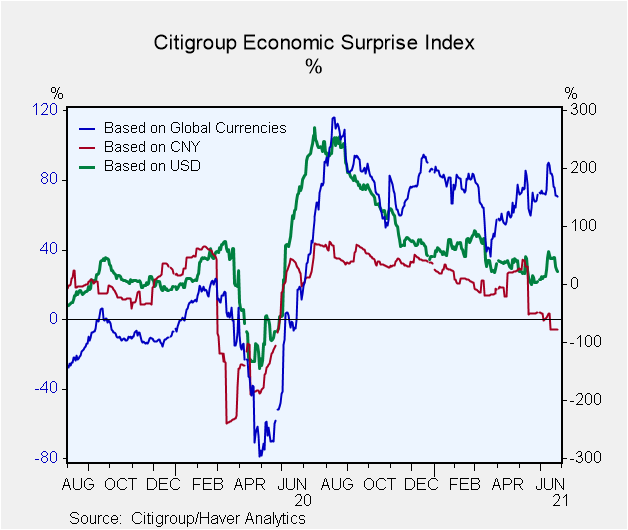
A fifth takeaway – and one that seems to have generated much less attention from economic commentators – is that higher inflation may already have begun to cool US economic growth. Incoming economic data from the US, for example, has tended to disappoint economic forecasters more frequently in recent weeks. In fact the Citigroup US economic surprise index has recently dipped into negative territory suggesting that negative data surprises have outweighed positive surprises (see figure 6 below). This incidentally has coincided with a downward trend in the China economic surprise index though this is probably rooted more in restrictive monetary policy rather than to higher inflation per se.
Figure 6: Economic surprise indices for China, the US and the world
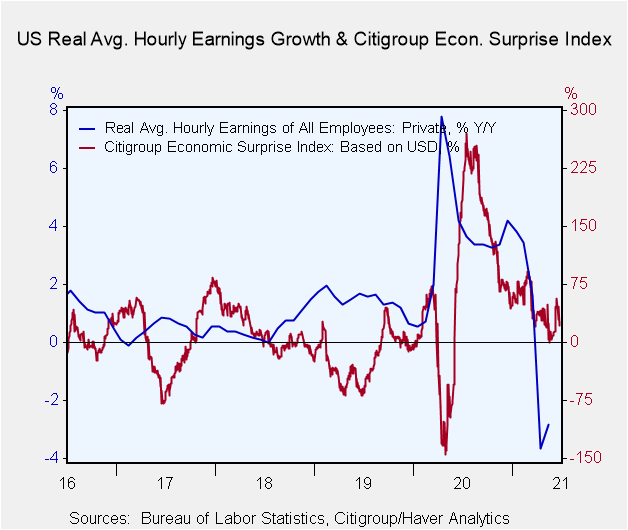
It's difficult to prove this conclusively but certainly one of the reasons for a weaker-than-expected batch of US economic data can be traced to higher inflation (see figure 7). Incoming retail sales data, for example, have disappointed expectations in April and May. In the meantime US real (i.e. inflation adjusted) average hourly earnings growth of private sector employees fell by 2.8% in the year to May. Relative to comparable data for a slightly narrower subset of the US labor force (i.e. production and non-supervisory workers) this is the sharpest retreat since the early 1980s. This is a reminder too though that the persistence of the latest inflation hiatus is conditional on several considerations including the degree of spare capacity in labor and product markets and follow-through from wage inflation.
Figure 7: US real average hourly earnings growth versus Citigroup US surprise index
Monetary policy is still very accommodative
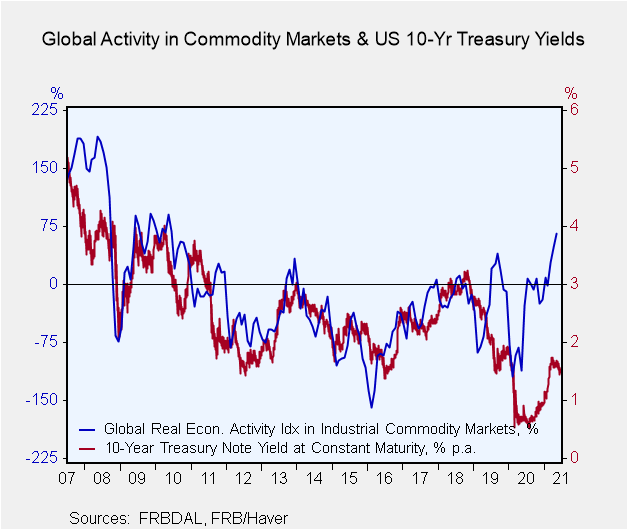
The sixth and final lesson concerns another key consideration for the inflation outlook, namely a still-high degree of monetary policy accommodation. Notwithstanding the message from incoming US data and negative rates of real wage growth there is no question that monetary policy in most developed economies is still exceptionally loose, and arguably far too loose. Figure 8 below puts some straightforward context on this. It compares the yield on 10 year US Treasuries with an index that's designed to measure the pace of global economic activity in commodity markets. The latter brings both global growth and inflation considerations in to the mix. And relative to those considerations, it suggests that the yield on US 10 year Treasuries is unusually low. This is obviously another way of saying that monetary policy is very loose relative to underlying global economic fundamentals.
Figure 8: US 10 year Treasury yields versus Global activity in commodity markets
What do these six lessons from H1 imply for H2? We think there are four implications:
• Firstly, further positive progress on the global growth front will remain heavily contingent on the pace and efficacy of vaccination programmes. Countries that perform relatively well will have probably vaccinating relatively heavily and vice versa.
• Secondly, prospective inflation pressures are contingent on the pace at which capacity can be expanded – along with the productivity ramifications - relative to further positive progress on global growth.
• Thirdly the US labor market – and US wage inflation in particular – may now hold the key for global economic stability in the immediate months ahead. Sharply higher wage inflation will obviously fuel inflation tensions and further complicate the efforts of the US Fed to maintain financial stability. Mediocre wage inflation, however, could further derail US consumer purchasing power and even perhaps the recovery more generally. .
• The final implication relates to additional evidence suggesting China's economy is now slowing down, which could, in turn, derail a recovery in world trade. Combined with the evidence suggesting that monetary policy (in developed economies) is still very loose relative to prevailing global economic conditions – which may force policymakers to tighten conditions more than markets expect – many (leveraged) emerging economies could see a much more unsettled period in the immediate months ahead.
Andrew Cates
AuthorMore in Author Profile »Andy Cates joined Haver Analytics as a Senior Economist in 2020. Andy has more than 25 years of experience forecasting the global economic outlook and in assessing the implications for policy settings and financial markets. He has held various senior positions in London in a number of Investment Banks including as Head of Developed Markets Economics at Nomura and as Chief Eurozone Economist at RBS. These followed a spell of 21 years as Senior International Economist at UBS, 5 of which were spent in Singapore. Prior to his time in financial services Andy was a UK economist at HM Treasury in London holding positions in the domestic forecasting and macroeconomic modelling units. He has a BA in Economics from the University of York and an MSc in Economics and Econometrics from the University of Southampton.


