U.S. Financial Accounts Show More Borrowing, Including Every Major Sector
Summary
- Q1 borrowing largest ever, except for early 2020 COVID recession period.
- Federal government generated biggest increase in Q1.
- Household borrowing, especially mortgages, was also sizable.
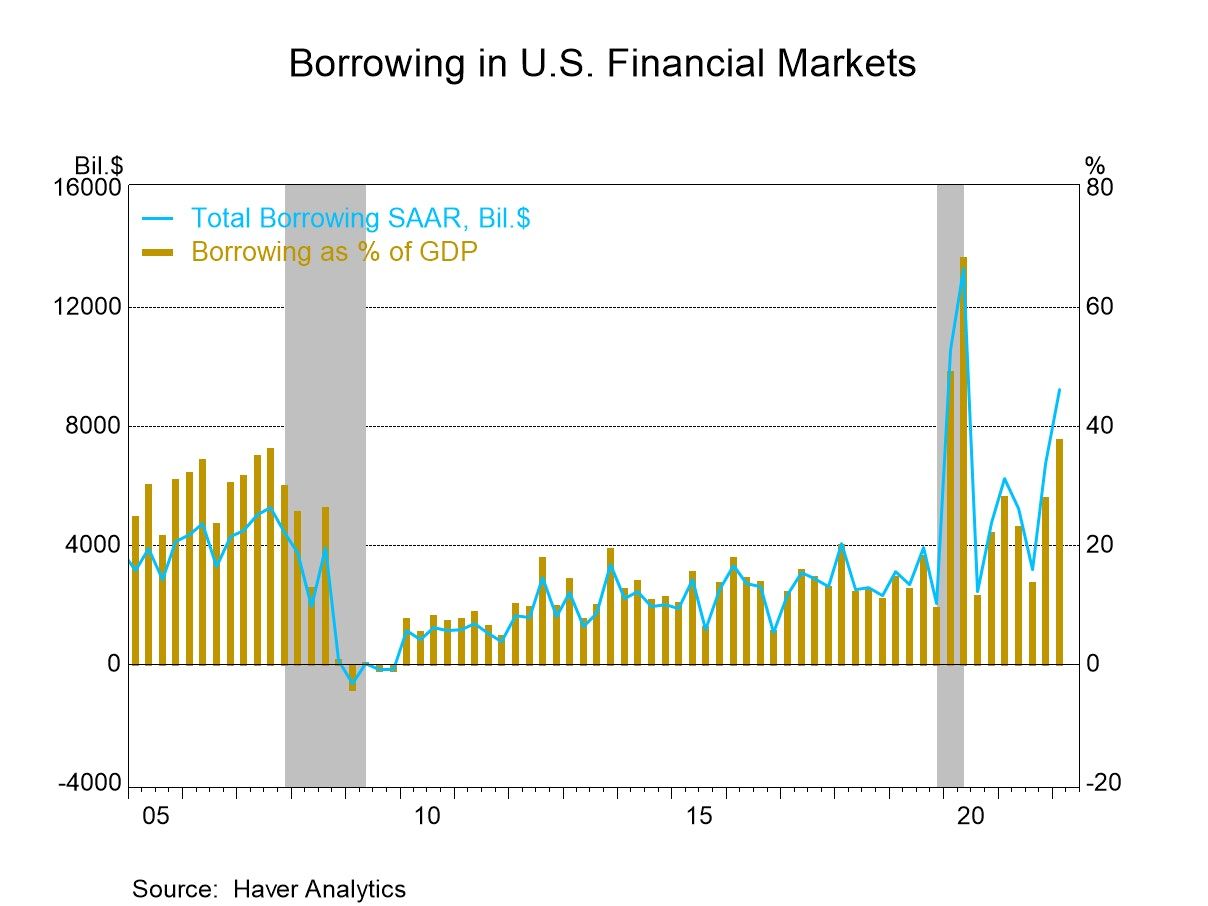

Borrowing in the U.S. economy expanded to $9.238 trillion in Q1 2022 from $6.761 trillion in Q4 2021, both at seasonally adjusted annual rates. The Q1 amount is 37.9% of GDP, up from 28.2% in Q4, and except for the COVID-recession borrowing surge in Q2 2020, is basically tied with Q4 1985 as the largest share of GDP at 38%.
The federal government was the main generator of the large Q1 borrowing amount, as it raised $3.766 trillion, up from $2.624 trillion in Q4 2021, that is, an increase of $1.142 trillion from the Q4 amount. Notably, the Q4 increase in borrowing was greater, $2.951 trillion, compared to a net paydown in Q3 of $327 billion. Bear in mind that all of these amounts are seasonally adjusted annual rates.
Households borrowed $1.491 trillion in Q1, just marginally larger than $1.403 trillion in Q4 2021. One-to-four family home mortgages made the main contribution, $1.012 trillion, up from $929 billion in Q4. Consumer credit increased $387 billion n Q1, up from $304 billion the previous quarter.
Nonfinancial corporate businesses borrowed $997 billion in Q1, up from $764 billion in Q4. Both these periods were concentrated in loans, which were $848 billion in Q1, following $857 billion in Q4. Net issuance of corporate bonds was just $149 billion in Q1 after net paydowns of $93 billion in q4.
Domestic financial institutions borrowed $2.119 trillion in Q1, up from $1.104 trillion in Q4. The Q1 amount consisted of $1.428 trillion in debt securities and $691 billion in loans.
Foreign borrowers, both private and governmental institutions, borrowed $479 billion in Q1, up from $419 billion in Q4.
Net wealth in the U.S. economy rose just $954 billion in Q1, not seasonally adjusted or annualized, a much smaller increase than $6.296 trillion in Q4. Household net worth eased $544 billion to $149.279 trillion after increasing $4.859 trillion in Q4.
The Financial Accounts data are in Haver's FFUNDS database. The Federal Reserve is the main source, while associated information is compiled in the Integrated Macroeconomic Accounts produced jointly with the Bureau of Economic Analysis (BEA); these are carried in Haver's USNA database as well as in FFUNDS. Note that revisions are common throughout the accounts with every quarterly release.


Carol Stone, CBE
AuthorMore in Author Profile »Carol Stone, CBE came to Haver Analytics in 2003 following more than 35 years as a financial market economist at major Wall Street financial institutions, most especially Merrill Lynch and Nomura Securities. She had broad experience in analysis and forecasting of flow-of-funds accounts, the federal budget and Federal Reserve operations. At Nomura Securities, among other duties, she developed various indicator forecasting tools and edited a daily global publication produced in London and New York for readers in Tokyo. At Haver Analytics, Carol was a member of the Research Department, aiding database managers with research and documentation efforts, as well as posting commentary on select economic reports. In addition, she conducted Ways-of-the-World, a blog on economic issues for an Episcopal-Church-affiliated website, The Geranium Farm. During her career, Carol served as an officer of the Money Marketeers and the Downtown Economists Club. She had a PhD from NYU's Stern School of Business. She lived in Brooklyn, New York, and had a weekend home on Long Island.
More Economy in Brief


 Global| Feb 05 2026
Charts of the Week: Balanced Policy, Resilient Data and AI Narratives
by:Andrew Cates

