 Global| Nov 03 2005
3Q U.S. Productivity Strong
by:Tom Moeller
|in:Economy in Brief
Summary
Growth in non-farm labor productivity of 4.1% last quarter was nearly double the upwardly revised growth during the prior quarter and easily surpassed Consensus expectations for a 2.5% rise. The increase lifted the year on year growth [...]
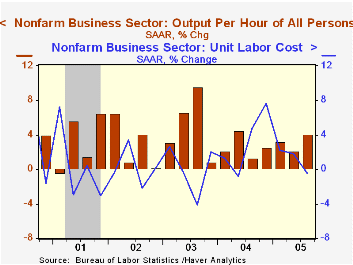
Growth in non-farm labor productivity of 4.1% last quarter was nearly double the upwardly revised growth during the prior quarter and easily surpassed Consensus expectations for a 2.5% rise. The increase lifted the year on year growth in worker productivity to 3.0%, its strongest since 2Q '04.
Output growth of 4.2% (4.2% y/y) was down slightly from a 4.4% increase during 2Q while hours worked grew a slight 0.1% (1.2% y/y).
The Bureau of labor Statistics indicated that the effects of Hurricanes Katrina & Rita could not be separately identified but that the effects were imbedded in the 3Q figures covering output, hours and compensation.
Unit labor costs fell 0.5%, the first quarterly decline since 2Q '04. The decline stemmed both from the strength in productivity as well as a moderate 3.6% (5.8% y/y) rise in compensation costs which was the slowest since 2Q '04.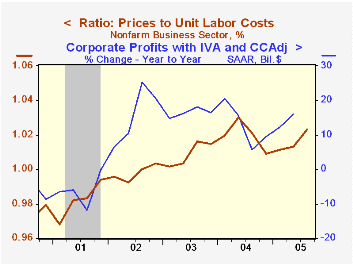
The implicit price deflator rose 3.3% (2.9% y/y) and the increase lifted the ratio of prices to unit labor costs to its highest since early last year. During the last ten years there has been a 58% correlation between the ratio and the y/y growth in corporate profits.
Factory sector productivity growth surged 4.5% (4.7% y/y) after a 3.6% rise during 2Q. Manufacturing compensation grew just 2.9% (7.2% y/y) which allowed unit labor costs to fall 1.6% (+2.5% y/y), the first decline since 2Q '04.Nonfinancial corporate sector productivity growth during 2Q was revised down to 6.3% (6.2% y/y) from 6.8% reported previously. Nevertheless, unit labor costs still fell 2.4% (+0.4% y/y) versus the initial estimate of a 2.6% decline. Output for this measure is gleaned from the income side of the National Income & Product Accounts (NIPA) as opposed to the non-farm output figures which are derived from the output side of the NIPA. Factory sector output is derived from the industrial production measures compiled by the Federal Reserve Board.
| Non-farm Business Sector (SAAR) | 3Q '05 | 2Q '05 | Y/Y | 2004 | 2003 | 2002 |
|---|---|---|---|---|---|---|
| Output per Hour | 4.1% | 2.1% | 3.0% | 3.4% | 3.8% | 4.0% |
| Compensation | 3.6% | 4.0% | 5.8% | 4.5% | 4.0% | 3.5% |
| Unit Labor Costs | -0.5% | 1.8% | 2.7% | 1.1% | 0.2% | -0.5% |

Tom Moeller
AuthorMore in Author Profile »Prior to joining Haver Analytics in 2000, Mr. Moeller worked as the Economist at Chancellor Capital Management from 1985 to 1999. There, he developed comprehensive economic forecasts and interpreted economic data for equity and fixed income portfolio managers. Also at Chancellor, Mr. Moeller worked as an equity analyst and was responsible for researching and rating companies in the economically sensitive automobile and housing industries for investment in Chancellor’s equity portfolio. Prior to joining Chancellor, Mr. Moeller was an Economist at Citibank from 1979 to 1984. He also analyzed pricing behavior in the metals industry for the Council on Wage and Price Stability in Washington, D.C. In 1999, Mr. Moeller received the award for most accurate forecast from the Forecasters' Club of New York. From 1990 to 1992 he was President of the New York Association for Business Economists. Mr. Moeller earned an M.B.A. in Finance from Fordham University, where he graduated in 1987. He holds a Bachelor of Arts in Economics from George Washington University.
More Economy in Brief

 Global| Feb 05 2026
Charts of the Week: Balanced Policy, Resilient Data and AI Narratives
by:Andrew Cates

