 Global| Nov 01 2011
A Better Than Expected Rise In UK's Q3 GDP But Still a Cloudy Outlook
Summary
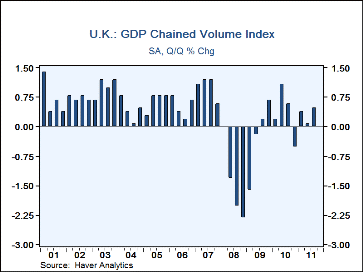
The British Office for National Statistics (ONS) released its first estimate of third quarter real GDP today. Total GDP is estimated to have increased 0.5% from the second quarter, as shown in the first chart. Production rose 0.5% [...]
The British Office for National Statistics (ONS) released its first estimate of third quarter real GDP today. Total GDP is estimated to have increased 0.5% from the second quarter, as shown in the first chart. Production rose 0.5% while construction declined 0.6% and services rose 0,7%. The estimate for total GDP was a bit better than expected, but has not allayed fears of a slow down in the fourth quarter due to the unsettled economic conditions surrounding the Europe's debt crisis and the impact of Prime Minister Cameron's budget squeeze. Moreover, part of the growth in the third quarter can be attributed to the restoration of supply lines that had been disrupted by the earthquake and tsunami in Japan and, in part to the absence of a royal wedding that reduced the number of working days.
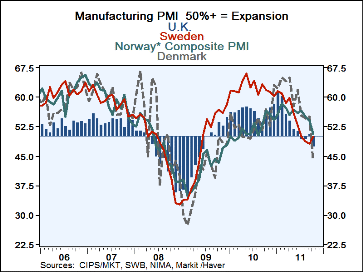
In October, the first month of the fourth quarter, purchasing managers began to sound the alarm. The PMI for Manufacturing in the United Kingdom fell to 47.4% from 50.8% (With 50+ = Expansion) in September. Three other European countries have recently reported purchasing managers indexes. Sweden showed a slight increase from 48.1% to 49.8% in its manufacturing PMI, but it is still below the expansion phase. The manufacturing PMI for Denmark was down sharply in October to 43.6% from 55.2% in September.& Norway does not produce a breakdown of its composite index. so we have used that in the following table and in the second chart. The composite was down significantly to 50.8% in October from 54.1% in September.
Note: PMIs for a number of countries are found in the data base, PMI--MARKIT PURCHASING MANAGERS SURVEYS. For those countries not in this database--Norway and Sweden for example, PMIs can frequently be found in the Country Sourced data in the Business Cycle Indicators and Surveys section.
| Percent Change Q/Q | Q3 11 |
Q2 11 |
Q1 11 |
Q4 10 |
Q3 10 |
Q2 10 |
Q1 10 |
Q4 09 |
|---|---|---|---|---|---|---|---|---|
| Gross National Product | 0.5 | 0.1 | 0.4 | -0.5 | 0.6 | 1.1 | 0.2 | 0.7 |
| Production | 0.5 | -1.2 | -0.1 | 0.1 | 0.3 | 1.2 | 1.3 | 0.3 |
| Construction | -0.6 | 1.1 | -2.7 | -1.8 | 3.2 | 8.2 | 0.9 | 0.3 |
| Services | 0.7 | 0.3 | 0.7 | -0.4 | 0.4 | 0.4 | -0.1 | 0.8 |
| Diffusion Index Manufacturing PMI | Oct 11 | Sep 11 | ||||||
| United Kingdom | 47.4 | 50.8 | ||||||
| Denmark | 43.6 | 55.2 | ||||||
| Norway* | 50.8 | 54.1 | ||||||
| Sweden | 49.8 | 48.1 | ||||||


