 Global| Jan 05 2010
A Double Dip In Singapore's GDP?
Summary
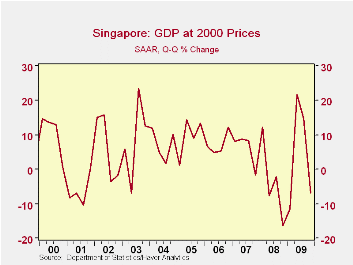
Advanced estimates indicate that Singapore's Gross Domestic Product declined at an annual rate of 6.8% in the fourth quarter, after having risen sharply in the two previous quarters. Such a pattern is not unusual in Singapore's [...]
 Advanced
estimates indicate that Singapore's Gross Domestic Product declined at
an annual rate of 6.8% in the fourth quarter, after having risen
sharply in the two previous quarters. Such a pattern is not
unusual in Singapore's experience, as can be seen in the first
chart, and it does not necessarily suggest that Singapore is
in for another recession. Preliminary data for the
fourth quarter and all of 2009 will be published in
February.
 The
advanced estimates are based largely
on production data for the first two months of the quarter--October and
November in this case. In addition to a typical industrial
production index, Singapore produces indexes based on clusters of
production in the chemical, electronic, biomedical, precision
engineering and transport engineering
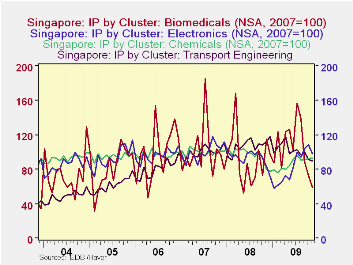
industries. The second chart shows the
trends in the indexes of the production for four of the five industry
clusters. Movements in the index for the fifth cluster,
Precision Engineering, are shown in the table below.
Production in the chemical and in the precision
engineering clusters increased in October and November.
Production in the electronics cluster increased in October
but fell off in November while production in the transport engineering
declined in both October and November.
 But the biggest change
was the sharp declines in the production of biomedicals, mainly
pharmaceuticals, in both October and November. Production in
the biomedical cluster has been subject to much wider swings than those
of the other clusters and is responsible, in large part, for the
erratic path of the quarterly changes in Singapore's
GDP.
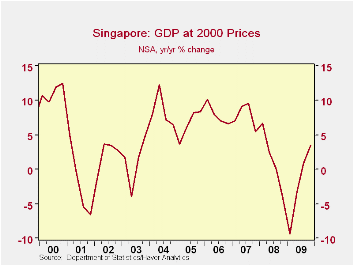
The year to year changes in real GDP are, perhaps, a better indicator of the course of Singapore's economy. These data are shown in the third chart and suggest that Singapore's recovery from recession is continuing.
| Real Gross Domestic Product | Q4 09 | Q3 09 | Q2 09 | Q1 09 | Q4 08 | Q3 08 | Q2 08 | Q1 08 | |
|---|---|---|---|---|---|---|---|---|---|
| M/M Annual Rate of Change in Real GDP (%0 | -6.8 | 14.9 | 21.6 | -11.5 | -16.4 | -2.1 | -7.7 | 12.2 | -- |
| Y/Y Rate of Change (%) | 3.5 | 0.9 | -3.2 | -9.4 | -4.2 | 0.0 | 2.5 | 6.7 | -- |
| Production by Industry Cluster (2007=100) | Nov 09 | Oct 09 | Sep 09 | Aug 09 | Jul 09 | Jun 09 | May 09 | Apr 09 | |
| Electronics | -- | 98.1 | 99.7 | 90.7 | 90.3 | 96.9 | 81.4 | 78.8 | 77.3 |
| Chemicals | -- | 92.6 | 91.2 | 92.9 | 90.2 | 95.9 | 89.4 | 82.9 | 80.6 |
| Biomedical | -- | 53.6 | 77.1 | 90.8 | 133.5 | 146.8 | 106.5 | 132.7 | 131.1 |
| Precision Engineering | -- | 85.4 | 84.7 | 83.0 | 78.6 | 76.8 | 78.8 | 93.8 | 95.7 |
| Transport Engineering | -- | 89.3 | 94.0 | 96.9 | 98.4 | 95.9 | 96.3 | 101.9 | 121.8 |
More Economy in Brief
 Global| Feb 05 2026
Charts of the Week: Balanced Policy, Resilient Data and AI Narratives
by:Andrew Cates


