 Global| Nov 23 2010
A Month of Strikes Does Little to Shake French Business Confidence
Summary
The overall indicator of the business climate in France was 104 in November, unchanged from October. The indicator is now 4 points above its long term average and 33 points above its low point of 71 in March 2009, but still below its [...]
The overall indicator of the business climate in France was 104 in November, unchanged from October. The indicator is now 4 points above its long term average and 33 points above its low point of 71 in March 2009, but still below its pre recession high of 114 in June 2007.
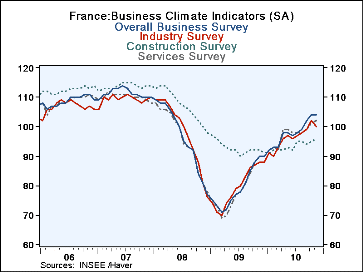
The overall indicator has three components: the construction sector climate, the services sector climate and the industry sector climate. The climate indicator for the construction sector rose from 95 in October to 96 in November and the climate indicator for the services sector rose from 101 in October to 102 in November. The climate indicator for industry declined from 102 in October to 100 in November. The decline was attributed to the widespread disruptions resulting from the strikes protesting President Sarkozy's plan to raise the retirement age. The strikes, which began in early September, came to a head at the end of October. The first chart shows the overall business climate indicator and its components: industry, construction and services.
The climate indicators are based on the responses of business leaders to questions concerning 1) Recent changes in output, 2) Inventories of finished goods, 3) Order books, 4) Foreign order books, 5) Personal production expectations, 6) Personal price expectations, 7) General production expectations and 8) General price expectations.
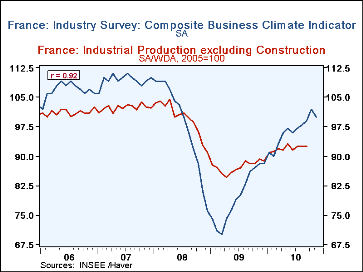
The Business Climate Indicator for Industry is a good, early predictor of Industrial Production, as can be seen in the second chart that compares the two series.
The high correlation and R2: 0.92 and .8464, respectively, attest to the significance of the relationshipThe business climate indicator is so designed that its long term average is 100 and its standard deviation is 10.
| Nov 10 | Oct 10 | Sep 10 | Aug 10 | Jul 10 | Jun 10 | May 10 | Apr 10 | Mar 10 | Feb 10 | Jan 10 | |
|---|---|---|---|---|---|---|---|---|---|---|---|
| Business Climate Indicator | 104 | 104 | 102 | 99 | 98 | 97 | 98 | 98 | 93 | 93 | 92 |
| Construction Sector | 96 | 95 | 94 | 95 | 95 | 92 | 93 | 92 | 92 | 92 | 91 |
| Service Sector | 102 | 101 | 99 | 98 | 98 | 98 | 99 | 99 | 92 | 93 | 92 |
| Industry Sector | 102 | 104 | 102 | 99 | 988 | 97 | 98 | 98 | 93 | 93 | 92 |
| Industrial Production (2005=100) | n.a. | n.a. | 92.5 | 92.4 | 92.4 | 91.6 | 93.1 | 91.6 | 92.0 | 91.2 | 90.9 |
More Economy in Brief
 Global| Feb 05 2026
Charts of the Week: Balanced Policy, Resilient Data and AI Narratives
by:Andrew Cates


