 Global| Feb 25 2008
ааа Rise in Singapore's Inflation Spotlights Rises in World Grain Pricesа
Summary
Inflation in Singapore rose more than expected to 6.61% in January of this year, 2.2 percentage points above the 4.41% in December. A big part of the rise was due to the government's increasing the valuation of public housing on which [...]

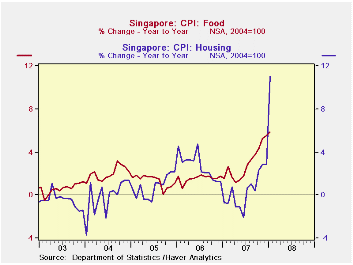
Inflation in Singapore rose more than expected to 6.61% in January of this year, 2.2 percentage points above the 4.41% in December. A big part of the rise was due to the government's increasing the valuation of public housing on which imputed rents are partly based. The housing component rose 11.03% in January after rising only 2.88% in December.
While the jum p in housing cost in December was somewhat of an anomaly, the rise in food prices has become a regular feature in the cost of living ever since mid 2007. The first chart shows that, except for the spike in the housing component in January, the food component has been increasing in importance relative to the housing component since early 2007.
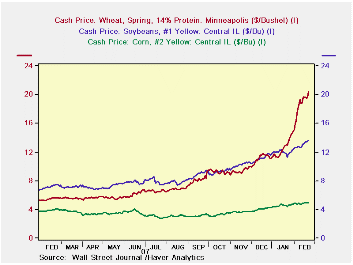
World grain prices rises have been pushing up the cost of food. The second chart shows the daily world prices of corn, soybeans and wheat for the past year. The continued rise in these prices in February suggests that further food inflation is in the works, not only for Singapore, but for most other countries.
| INFLATION (Y/Y %Chg in CPI) | Jan 08 | Dec 07 | Nov 07 | Oct 07 | Sep 07 | Jul 07 | Jun 07 | 2007 | 2006 |
|---|---|---|---|---|---|---|---|---|---|
| Singapore | |||||||||
| Total | 6.61 | 4.41 | 422 | 3.63 | 2.76 | 2.96 | 2.56 | 2.10 | 0.96 |
| Food | 5.84 | 5.50 | 5.22 | 4.27 | 2.75 | 3.30 | 2081 | 1.56 | 1.33 |
| Housing | 11.03 | 2.88 | 2.88 | 2.30 | 0.39 | 1.06 | 9.67 | 0.45 | 2.67 |
More Economy in Brief
 Global| Feb 05 2026
Charts of the Week: Balanced Policy, Resilient Data and AI Narratives
by:Andrew Cates


