 Global| Feb 04 2009
ADP Report: Payroll EmploymentFell Another 522,000
by:Tom Moeller
|in:Economy in Brief
Summary
In its latest National Employment Report, the payroll processor ADP indicated that private nonfarm payrolls fell 522,000 during January after a revised 659,000 decline during December. The decline was the thirteenth consecutive [...]
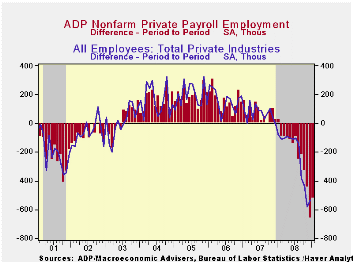
In its latest National Employment Report, the payroll processor ADP indicated that private nonfarm payrolls fell 522,000 during January after a revised 659,000 decline during December. The decline was the thirteenth consecutive monthly decline and during the last three months, payrolls have fallen at a 5.6% annual rate.
The U.S. Bureau of Labor Statistics will report on December payroll employment this Friday. Last month, the 659,000 worker decline (-2.2% y/y) in ADP's measure of private nonfarm payrolls was accompanied by a 531,000 worker decline (-2.4% y/y) in the BLS measure of private sector payrolls.According to ADP and Macro Advisers, the correlation between the monthly percentage change in the ADP estimate and that in the BLS data is 0.90.Employment in the service producing industry again fell hard. The 279,000 (-1.7% y/y) drop was the twelfth consecutive monthly decline. Medium sized payrolls fell 135,000 (-2.1% y/y) and small sized payrolls fell 101,000 (-1.3% y/y). Large service producing payrolls dropped by 43,000 (-2.0% y/y).
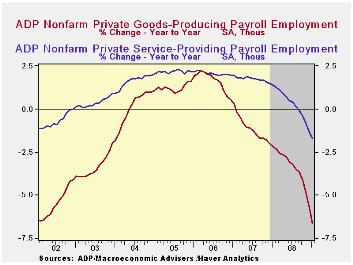
Weakness in goods producing payrolls added again to the
service sector's decline with a 243,000 (-6.6% y/y) drop. Medium sized
payrolls fell 120,000 (-6.8% y/y) followed by a 74,000 (-6.0% y/y) drop
in small sized payrolls. Large payrolls fell 49,000 (-7.5% y/y).
Employment in the manufacturing sector fell 160,000 (-6.3% y/y) in January. It has fallen in almost every month since 2001.
ADP compiled the estimate from its database of individual companies' payroll information. Macroeconomic Advisers, LLC, the St. Louis economic consulting firm, developed the methodology for transforming the raw data into an economic indicator.
The ADP National Employment Report data is maintained in Haver's
USECON database; historical figures date back to December 2000. The figures in this report cover only private sector jobs and exclude employment in the public sector, which rose an average 11,083 during the last twelve months.The full ADP National Employment Report can be found here,
and the ADP methodology is explained here.
| LAXEPA@USECON | January | December | Y/Y | 2008 | 2007 | 2006 |
|---|---|---|---|---|---|---|
| Nonfarm Private Payroll Employment (m/m Chg.) | -522,000 | -659,000 | -2.7% | -0.4 | 1.2% | 2.0% |
January U.S. Light Vehicle Sales Lowest Since 1982
by Tom Moeller February 4, 2009
Consumers' aversion to purchasing autos continued last month. U.S. sales of light vehicles fell a surprising 7.1% m/m to 9.57M (SAAR) from 10.31M during December. Sales of 10.2M had been expected for January. The latest figure was the lowest since 1982 according to the Autodata Corporation and Ward's Automotive News. (Seasonal adjustment of the figures is provided by the U.S. Bureau of Economic Analysis). The decline pulled the comparison versus a year ago to -37.7% which was its worst since the data became available in the late 1960s.
Sales of domestically-made light vehicles
were particularly hard hit as they posted a 12.2% decline from December
to 6.75M units. The level is now 42.4% below that in January 2008.
Sales of domestically made autos fell a hard 20.8% m/m, enough to pull
the comparison versus a year earlier to -43.7%. Light truck sales fell
4.6% for the month (-41.4% y/y).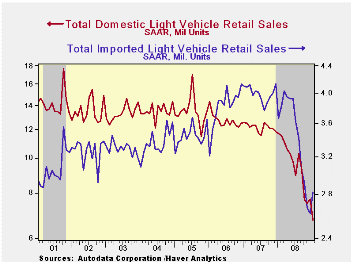
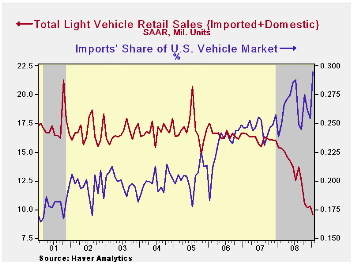
Imported light vehicle sales outperformed the domestics again last month as they posted a 7.6% increase. Moreover, while sales fell 22.8% year-to-year, the decline is roughly half that for U.S. made vehicles. Sales of imported light trucks were the strongest as they increased 6.0% from January. The increase enabled sales of imported light trucks to grab 21.4% of total market share, a record and double the share of ten years earlier. Sales of imported autos also firmed and rose 8.5% (-23.0% y/y) after two months of decline.
Higher truck sales pulled import's share of the U.S. light vehicle market to a record 29.5%, up three percentage points from the 2008 average. (Imported vehicles are those produced outside the U.S. and do not include vehicles with the nameplate of a foreign manufacturer produced within the U.S.)
| Light Vehicle Sales (SAAR, Mil. Units) | January | December | Jan. / Jan. | 2008 | 2007 | 2006 |
|---|---|---|---|---|---|---|
| Total | 9.57 | 10.31 | -37.7% | 13.17 | 16.16 | 16.54 |
| Autos | 4.60 | 5.21 | -37.2 | 6.71 | 7.58 | 7.77 |
| Domestic | 2.84 | 3.59 | -43.7 | 4.42 | 5.07 | 5.31 |
| Imported | 1.76 | 1.62 | -23.0 | 2.29 | 2.52 | 2.45 |
| Light Trucks | 4.97 | 5.10 | -38.2 | 6.47 | 8.60 | 8.78 |
| Domestic | 3.91 | 4.10 | -41.4 | 5.29 | 7.10 | 7.42 |
| Imported | 1.06 | 1.00 | -22.6 | 1.18 | 1.47 | 1.37 |
EMU Consumer Spending Tanks Along With Spending Plans
by Robert Brusca February 4, 2009
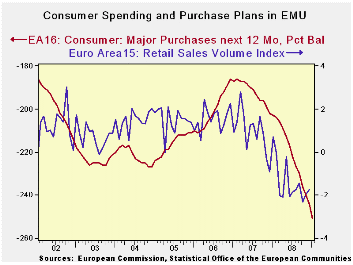
The chart at top shows the Yr/Yr trend in EMU consumer
spending. It is working its way lower, lead by a declining trend in
consumer spending plans. The Yr/Yr drops seem to have stopped to hover
around the -2% pace, Yr/Yr. But the table shows that more recently
downward momentum seems to have picked up. Over six months the sales
volume is only lower at a 1.2% annual rate but over three-months that
is down to a -4.4% pace. The drop in the pace of nonfood items has
accelerated even more sharply over the recent 3-months as economic
conditions have worsened. Despite some really poor consumer sentiment
surveys spending in the UK is holding up. In Germany, though,
conditions are poor.
| Ezone (15) Retail Sales Volume | ||||||
|---|---|---|---|---|---|---|
| Dec-08 | Nov-08 | Oct-08 | 3-Mo | 6-MO | 12-Mo | |
| Zone-15 Total | 0.0% | -0.1% | -1.0% | -4.4% | -1.2% | -1.7% |
| Food | 0.2% | -0.1% | -0.7% | -2.2% | 0.0% | -1.1% |
| NonFood | -0.4% | -0.2% | -1.1% | -6.6% | -2.2% | -2.3% |
| Textiles | #N/A | -0.5% | -3.1% | -4.3% | -6.6% | -2.1% |
| Books news, etc | #N/A | -1.1% | -1.1% | -9.0% | -5.0% | -3.9% |
| Pharma | #N/A | 0.2% | -0.6% | -1.6% | 1.1% | 0.6% |
| Other NonSpec | #N/A | 0.3% | 0.1% | -0.6% | -3.6% | -2.0% |
| Mail Order | #N/A | -0.1% | -1.9% | -4.3% | -1.9% | -0.6% |
| Country detail; Volume | ||||||
| Germany: VolxAuto | -0.2% | -0.1% | -0.9% | -4.6% | 0.6% | 0.2% |
| Italy (Total; Value) | #N/A | -0.2% | -0.4% | -1.5% | -1.5% | -1.3% |
| UK (EU): Vol | 1.6% | 0.3% | -0.2% | 6.7% | 6.2% | 3.9% |
| Shaded areas calculated on a one-month lag due to lagging data | ||||||
| The EA 13 countries are Austria, Belgium, Finland, France, Germany, | ||||||
| Greece, Ireland, Italy, Luxembourg, the Netherlands, Portugal, Slovenia | ||||||
EMU Services PMI's Slow Descent Signal In January
by Robert Brusca February 4, 2009
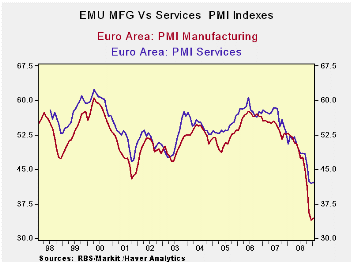
The EMU Services PMIs from Market show continued weakness in
EMU and UK service sectors but not accelerating weakness.
The signal for the Zone is just one month up from its low.
Country indices are low in their respective ranges, but generally they
are not on their bottoms. Germany for example saw its service sector
slip further this month; it now lies in the bottom 10 percentile of its
range. Italy and the UK each saw some of their weakness dissipate yet
they remain the worst tow countries with the lowest services diffusion
readings in this grouping. . The EU Commission’s measures on services
and confidence are generally a bit weaker and are at or nearer all time
lows compared to the Market treatment for services.
The bounce in services in Europe is echoed by the bounce in
the US non-MFG ISM, the closest US measure to these European service
sector indices. The US ISM is in the bottom 23% of its range. Europe
and the US seem to be passing though this cycle with remarkably similar
impacts on their respective goods and services sectors.
| NTC Services Indices for EU/EMU | |||||||
|---|---|---|---|---|---|---|---|
| Jan-09 | Dec-08 | Nov-08 | 3Mo | 6Mo | 12Mo | Percentile | |
| Euro-13 | 42.16 | 42.06 | 42.47 | 42.23 | 44.89 | 47.77 | 0.5% |
| Germany | 45.20 | 46.57 | 45.14 | 45.64 | 47.81 | 50.40 | 10.7% |
| France | 42.56 | 40.57 | 46.17 | 43.10 | 45.84 | 49.27 | 8.0% |
| Italy | 41.10 | 40.30 | 39.46 | 40.29 | 44.07 | 46.03 | 7.0% |
| Spain | 31.84 | 32.10 | 28.23 | 30.72 | 33.24 | 37.17 | 11.1% |
| Ireland | 33.94 | 34.14 | 32.60 | 33.56 | 36.23 | 40.52 | 3.7% |
| EU only | |||||||
| UK (CIPs) | 42.48 | 40.21 | 40.06 | 40.92 | 43.38 | 46.76 | 11.8% |
| US NONFMG ISM | 42.90 | 40.10 | 37.40 | 40.13 | 44.23 | 47.21 | 22.9% |
| EU Commission Indices for EU and EMU | |||||||
| EU Index | Jan-09 | Dec-08 | Nov-08 | 3Mo | 6Mo | 12Mo | Percentile |
| EU Services | -28 | -23 | -18 | -28.67 | -24.67 | -19.67 | 0.0% |
| EMU | Jan-09 | Dec-08 | Nov-08 | 3Mo | 6Mo | 12Mo | Percentile |
| Services | -22 | -17 | -12 | -17.00 | -9.50 | -2.58 | 0.0% |
| Cons Confidence | -31 | -30 | -25 | -28.67 | -24.67 | -8.28 | 0.0% |
| Consumer confidence by country | |||||||
| Germany-Ccon | -27 | -22 | -15 | -21.33 | -15.67 | -9.50 | 0.0% |
| France-Ccon | -35 | -34 | -29 | -32.67 | -29.50 | -23.75 | 0.0% |
| Ital-Ccon | -26 | -30 | -26 | -27.33 | -25.17 | -24.17 | 12.5% |
| Spain-Ccon | -44 | -46 | -44 | -44.67 | -42.33 | -35.58 | 4.2% |
| UK-Ccon | -35 | -29 | -27 | -30.33 | -27.50 | -21.50 | 0.0% |
| percentile is over range since May 2000 | |||||||
U.S. ISM Nonmanufacturing Index Moved Higher Again
by Tom Moeller February 4, 2009
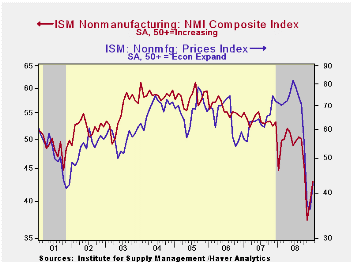
The January Composite Index for the nonmanufacturing sector
from the Institute for Supply Management (ISM) rose for the second
consecutive month. The rise to 42.9 raised the level to its highest
since October and it was much firmer than Consensus expectations for a
reading of 39.0. A level of the ISM indices below 50 indicates
declining activity. Since the series' inception in 1997 there has been
a 48% correlation between the level of the business activity index for
the nonmanufacturing sector and the Q/Q change in real GDP for the
services and the construction sectors.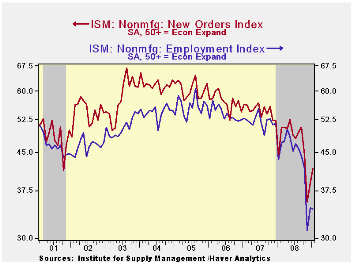
The rise in the overall figure last month was led by improvement in the business activity sub-component, also its highest since October. The new orders sub-index increased as well to 41.6.
The employment index was relatively less robust and was about unchanged from December at 34.4, but that was still up moderately from the November low. Since the series' inception in 1997 there has been a 56% correlation between the level of the ISM nonmanufacturing employment index and the m/m change in payroll employment in the service-producing plus the construction industries.
Pricing power firmed as well to a reading of 42.5 which was the highest since October. Since its inception ten years ago, there has been a 60% correlation between the price index and the q/q change in the GDP services chain price index.
Beginning with the January 2008 Nonmanufacturing Report On Business®, the composite index is calculated as an indicator of the overall economic condition for the non-manufacturing sector. It is a composite index based on the diffusion indexes for four of the indicators (business activity, new orders, employment and supplier deliveries) with equal weights. The latest report from the ISM can be found here.
ISM surveys more than 370 purchasing managers in more than 62 industries including law firms, hospitals, government and retailers. The nonmanufacturing survey dates back to July 1997.
| ISM Nonmanufacturing Survey | January | December | January '08 | 2008 | 2007 | 2006 |
|---|---|---|---|---|---|---|
| Composite Index | 42.9 | 40.1 | 44.6 | 47.4 | 53.5 | 55.7 |
| Prices Index | 42.5 | 36.1 | 71.2 | 66.0 | 63.8 | 65.3 |
Challenger Layoffs Highest Since 2002
by Tom Moeller February 4, 2009
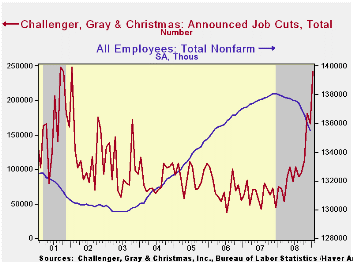
Challenger, Grey & Christmas reported that January job cut announcements soared to 241,749 following 166,348 layoffs during December. The latest figure was the highest since early-2002.
Job cut announcements in the retail industry led overall with 53,968. The industrial goods industry was not far behind with 32,083 layoffs and in the computer industry there were 22,330 job cuts. Announced were 22,063 layoffs in the pharmaceutical industry, 17,195 layoffs in the chemical industry and the electronics industry shed 11,050 jobs
During the last ten years there has been a 67% (inverse) correlation between the three month moving average of announced job cuts and the three month change payroll employment.
Job cut announcements differ from layoffs. Many are achieved through attrition, early retirement or just never occur.
Challenger also reported that announced hiring plans were up sharply from the prior three months.
The Challenger figures are available in Haver's SURVEYS database.
| Challenger, Gray & Christmas | January | December | Y/Y | 2008 | 2007 | 2006 |
|---|---|---|---|---|---|---|
| Announced Job Cuts | 241,749 | 166,348 | 222.4% | 1,223,993 | 768,264 | 839,822 |

Tom Moeller
AuthorMore in Author Profile »Prior to joining Haver Analytics in 2000, Mr. Moeller worked as the Economist at Chancellor Capital Management from 1985 to 1999. There, he developed comprehensive economic forecasts and interpreted economic data for equity and fixed income portfolio managers. Also at Chancellor, Mr. Moeller worked as an equity analyst and was responsible for researching and rating companies in the economically sensitive automobile and housing industries for investment in Chancellor’s equity portfolio. Prior to joining Chancellor, Mr. Moeller was an Economist at Citibank from 1979 to 1984. He also analyzed pricing behavior in the metals industry for the Council on Wage and Price Stability in Washington, D.C. In 1999, Mr. Moeller received the award for most accurate forecast from the Forecasters' Club of New York. From 1990 to 1992 he was President of the New York Association for Business Economists. Mr. Moeller earned an M.B.A. in Finance from Fordham University, where he graduated in 1987. He holds a Bachelor of Arts in Economics from George Washington University.
More Economy in Brief


