 Global| Sep 30 2009
ADP Report: Sharp Decline InNonfarm Payroll Employment Continues
by:Tom Moeller
|in:Economy in Brief
Summary
The sharp decline in payroll employment continued this month, but the rate of decline recently has stabilized. The latest report from the payroll processor ADP, in their National Employment Report, indicated that private nonfarm [...]
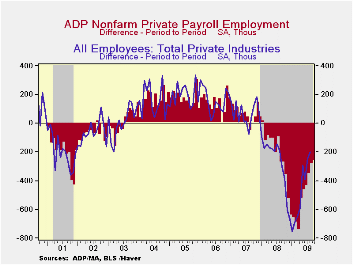
The sharp decline in payroll employment continued this month, but the rate of decline recently has stabilized. The latest report from the payroll processor ADP, in their National Employment Report, indicated that private nonfarm payrolls fell 254,000 during September. That followed a revised 277,000 August decline which was slightly shallower than reported initially. The latest reading was the twentieth consecutive monthly decline. The monthly change was, however, the smallest since July of last year and two-thirds the size of the worst reading last March. The three-month annualized rate of decline in payrolls also eased to 3.2% from its March record of 7.1%.
ADP compiled the estimate from its database of individual companies' payroll information. Macroeconomic Advisers, LLC, the St. Louis economic consulting firm, developed the methodology for transforming the raw data into an economic indicator.
The U.S. Bureau of Labor Statistics will report September payroll employment this Friday. For comparison, the August decline of 277,000 in ADP's measure of private nonfarm payrolls was accompanied by a loss of 198,000 jobs in the BLS measure of private sector payrolls. According to ADP and Macro-Advisers, the correlation between the monthly percentage change in the ADP estimate and that in the BLS data is 0.90.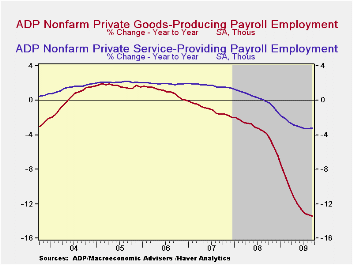
ADP reported that small-sized payrolls again fell the most this month and posted a 100,000 decline (-4.4%). That was similar to the 93,000 (-5.7% y/y) decline in medium-sized payrolls. Large payrolls fell by 61,000 (-5.7% y/y). The steady decline in service-producing industry employment continued. The September drop, which measured 103,000 (-3.2% y/y), was the eighteenth consecutive monthly decline but in percentage terms the three-month rate of change moderated to -1.8%. The recent declines are less than two-thirds the worst from December through March. Medium-sized service payrolls fell 38,000 (-3.6% y/y) and small-sized payrolls declined 38,000 (-2.9% y/y). Large service producing payrolls dropped by 27,000 (-3.5% y/y).
In the goods producing sector there were 151,000 fewer jobs in September (-13.4% y/y). Here, the three-month rate of change eased again but only to -9.6% versus -17.3% at its worst. Small-sized payrolls fell 62,000 (-13.1% y/y) followed by a 55,000 (-13.7% y/y) drop in medium-sized payrolls. Large payrolls fell 34,000 (-13.4% y/y). In the manufacturing sector alone, payrolls fell a steady 74,000 (-12.8% y/y).
The ADP National Employment Report data is maintained in Haver's
USECON database; historical figures date back to December 2000. The figures in this report cover only private sector jobs and exclude employment in the public sector, which rose an average 11,083 during the last twelve months.The full ADP National Employment Report can be found here
and the ADP methodology is explained here.| LAXEPA@USECON | September | August | Y/Y | 2008 | 2007 | 2006 |
|---|---|---|---|---|---|---|
| Total Nonfarm Private Payroll Employment (m/m Chg., 000s) | -254 | -277 | -5.1% | -0.5% | 1.2% | 2.0% |
| Small Payroll (1-49) | -100 | -114 | -4.4 | -0.0 | 1.6 | 2.2 |
| Medium Payroll (50-499) | -93 | -106 | -5.7 | -0.5 | 1.2 | 1.9 |
| Large Payroll (>500) | -61 | -57 | -5.7 | -1.6 | -0.1 | 0.4 |
Consumer Confidence Spurts in UK
by Robert Brusca September 30, 2009
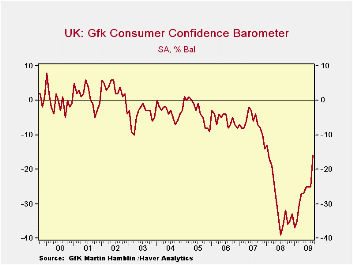
U.K. consumer confidence jumped in September by the most since
1995 as optimism about the economy’s prospects rebounded, according to
GfK NOP. The index of confidence jumped by the greatest amount since
1995 and the level reading of -16 is it’s highest Since January of 2008.
Still the headline reading is only in the 57th percentile of
its 10-Year range. And the headline, at -16, is still negative.
The current and past readings on the index are still sour. The
financial situation over the past 12 months is a bottom 29 percentile
reading while the current financial situation is rated in the 36th
percentile a bare-bones increase. But for the next 12-months the rating
flies up to 71st percentile. Even with that, the environment for making
a major purchase only rises from a 45th percentile response currently
to a 48th percentile response in the future. Improvement? Yes! Much
improvement? No!
The general economic situation is rated in the 27th percentile
over the past 12 months that jumps to the highest reading in at least
10-years over the next 12-months.
Deja-What?
We have seen this sort of thing before. We got exactly the
same sort of response from Italy’s consumers within the last week.
There is a great belief on the part of consumers that in the
next12-months things are going to be much better than they were and
than they are. Meanwhile, although global stock markets are rising
sharply, there is a lot of stock market pessimism and the rise itself
has been accomplished on low volume for the most part. Government
projections for growth are moderate-to-downbeat and private sector
economists have been dragged every step of the way to an improved
forecast by ever improving economic data. It is curious that with
pessimism in the wind in the woodwork everywhere that consumers are so
upbeat. Are they right to be confident –do they know something? Or, are
they just naïve? In Italy we have observed that a day after its
consumers were so upbeat the business sentiment survey there
backtracked.
Expectations…
Very clearly this is a recovery with expectations scattered to the
winds. It is hard to tell what a given group will think and why, let
alone how long, that they will think it. We have markets that
outperform expectations but without believers. After the last 12-months
it is not surprising to have confusion, but despite some very active
government intervention it is strange indeed that consumers are the
most impressed and businesses are skeptical and financial experts seem
apoplectic with the good news to the point to disbelief or even
rejection.
Impact on performance
All of this has to affect how the economy actually performs. We know
that expectations are important but we also know they are not etched in
stone and we can debate how much they affect behavior. For the time
being the consumer seems to be the backbone of whatever optimism we
have. This is clear in the UK and in the Italy; it seems somewhat the
same in the US. Will it be enough to keep the consumer-led expansions
going? Since we depend on the consumers’ spending it may be. But note
the dark side to the UK response on spending; it is different from the
Italian response. In the UK there is skepticism that the buying climate
will improve by much but in Italy a big improvement is expected in that
climate. On balance we can say that consumers appear to be more
optimistic than most but we cannot say that their optimism is for the
same reasons and therefore it might not be well-grounded.
| GFK Consumer Survey | ||||||
|---|---|---|---|---|---|---|
| % of 2Yr | % of 10Yr | |||||
| Sep-09 | Aug-09 | Jul-09 | Jun-09 | Range | Range | |
| Consumer Confidence | -16 | -25 | -25 | -25 | 65.7% | 57.5% |
| Current | ||||||
| Household Financial Situation | 18 | 14 | 15 | 16 | 36.4% | 36.4% |
| Major Purchases | -15 | -26 | -25 | -26 | 59.6% | 45.9% |
| Last 12 Months | ||||||
| Household Financial Situation | -13 | -18 | -19 | -18 | 29.2% | 29.2% |
| General Economic Situation | -63 | -69 | -72 | -73 | 33.3% | 27.5% |
| CPI | 67 | 62 | 65 | 68 | 10.4% | 37.7% |
| Savings | -5 | -10 | -12 | -15 | 29.9% | 29.9% |
| Next 12-Months | ||||||
| Household Financial Situation | 5 | 0 | 0 | 1 | 74.2% | 71.9% |
| General Economic Situation | 4 | -9 | -8 | -8 | 100.0% | 100.0% |
| Unemployment | 46 | 53 | 56 | 57 | 38.8% | 50.8% |
| Major Purchases | -28 | -36 | -36 | -36 | 54.5% | 48.0% |
| Savings | 0 | -1 | 1 | -2 | 13.0% | 11.5% |
| CPI | 58 | 52 | 51 | 49 | 35.3% | 35.3% |
| By Income | ||||||
| Lower | -23 | -30 | -31 | -31 | 59.5% | 51.2% |
| Upper | -12 | -15 | -16 | -15 | 60.6% | 51.3% |
Q2 GDP Fell A Lessened 0.7%; Hesitant Profits Recovery Continues
by Tom Moeller September 30, 2009
 The second
revision of GDP growth last quarter showed that activity fell slightly
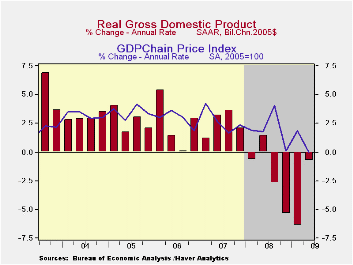
less than initially estimated. A 0.7% (AR) 2Q decline compared to 1.0%
declines indicated in the two prior reports. During the course of the
numbers' release, the decline in domestic final demand has been
lessened to 0.9% after a 6.4% collapse to open the year. That easing
has offset an increased negative influence from inventory
decumulation.
The second
revision of GDP growth last quarter showed that activity fell slightly
less than initially estimated. A 0.7% (AR) 2Q decline compared to 1.0%
declines indicated in the two prior reports. During the course of the
numbers' release, the decline in domestic final demand has been
lessened to 0.9% after a 6.4% collapse to open the year. That easing
has offset an increased negative influence from inventory
decumulation.
Inventory decumulation
continued as the major drag on GDP growth last quarter with a 1.4
percentage point reduction that was unrevised. Final demand revisions
were modest. Consumer spending is now estimated to have fallen at a
0.9% annual rate (-1.7% y/y) led by a 5.6% (-8.8% y/y) drop in durables
consumption. Residential investment fell at a little-revised 23.2% rate
-25.6% y/y) and business investment dropped at a 9.6% rate (-19.7% y/y)
which was similar to earlier reports. 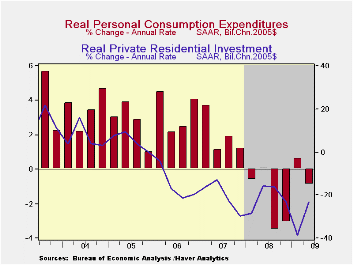 Government investment rose at a
little revised 6.7% rate (2.5% y/y) and exports declined at a lessened
4.1% rate. Imports dropped 14.7%; therefore, net-foreign trade
improvement added 1.7 percentage points to 2Q GDP growth.
Government investment rose at a
little revised 6.7% rate (2.5% y/y) and exports declined at a lessened
4.1% rate. Imports dropped 14.7%; therefore, net-foreign trade
improvement added 1.7 percentage points to 2Q GDP growth.
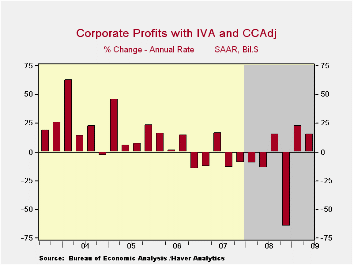
Corporate profits in Q2 rose 3.7% (-12.6% y/y) pre-tax, including IVA and CCA, from Q1 which was slightly less of a rise than reported initially. The latest gain followed a 5.3% 1Q increase but both just dented a 22.8% 4Q decline. Financial industries saw their quarterly profits gain 12.0% in Q2 (-1.8% y/y) after having nearly doubled in Q1 versus 4Q. Nonfinancial company profits improved last quarter by a marginally unrevised 4.7% (-7.5% y/y). Rest of world profits fell for the fifth quarter in the last six and by 4.6% (-17.9% y/y).
The GDP price deflator was unrevised and was unchanged from 1Q. A 1.4% gain (-0.2% y/y) in the PCE price index followed a 1.5% 1Q decline. Overall, the domestic final sales price index rose at a negligible 0.5% rate (-0.3% y/y).
The U.S. National Income & Product Account data are available in Haver's USECON and the USNA databases.
Excerpts from Dallas Fed Chairman Richard W. Fisher's remarks before the Texas Christian University Business Network of Dallas can be found here.
| Chained 2005$, % AR | 2Q '09 (3rd Release) | 2Q '09 (2nd Release) | 2Q '09 (Advance) | 1Q '09 | 2Q Y/Y | 2008 | 2007 | 2006 |
|---|---|---|---|---|---|---|---|---|
| GDP | -0.7 | -1.0 | -1.0 | -6.4 | -3.8 | 0.4 | 2.1 | 2.7 |
| Inventory Effect | -1.4 | -1.4 | -0.8 | -2.4 | -1.0 | -0.4 | -0.4 | 0.1 |
| Final Sales | 0.7 | 0.4 | -0.2 | -4.1 | -2.8 | 0.8 | 2.5 | 2.6 |
| Foreign Trade Effect | 1.7 | 1.6 | 1.4 | 2.6 | 0.9 | -1.2 | 0.8 | 0.1 |
| Domestic Final Demand | -0.9 | -1.2 | -1.5 | -6.4 | -3.7 | -0.4 | 1.7 | 2.5 |
| Chained GDP Price Index | 0.0 | 0.0 | 0.2 | 1.9 | 1.5 | 2.1 | 2.9 | 3.3 |

Tom Moeller
AuthorMore in Author Profile »Prior to joining Haver Analytics in 2000, Mr. Moeller worked as the Economist at Chancellor Capital Management from 1985 to 1999. There, he developed comprehensive economic forecasts and interpreted economic data for equity and fixed income portfolio managers. Also at Chancellor, Mr. Moeller worked as an equity analyst and was responsible for researching and rating companies in the economically sensitive automobile and housing industries for investment in Chancellor’s equity portfolio. Prior to joining Chancellor, Mr. Moeller was an Economist at Citibank from 1979 to 1984. He also analyzed pricing behavior in the metals industry for the Council on Wage and Price Stability in Washington, D.C. In 1999, Mr. Moeller received the award for most accurate forecast from the Forecasters' Club of New York. From 1990 to 1992 he was President of the New York Association for Business Economists. Mr. Moeller earned an M.B.A. in Finance from Fordham University, where he graduated in 1987. He holds a Bachelor of Arts in Economics from George Washington University.
More Economy in Brief

 Global| Feb 05 2026
Charts of the Week: Balanced Policy, Resilient Data and AI Narratives
by:Andrew Cates

