 Global| Oct 09 2007
August Trade in Goods: a Dip in Germany's Surplus and a Small Improvement in France's Deficit
Summary
The balance of trade in goods in France improved from a deficit of 3.2 billion euros in July to 2.8 billion euros in August. In Germany, the surplus on trade in goods declined to 15.3 billion euros from 16.5 billion euros in July. [...]


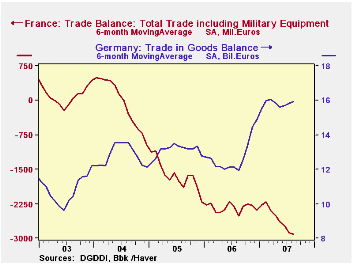
The balance of trade in goods in France improved from a deficit of 3.2 billion euros in July to 2.8 billion euros in August. In Germany, the surplus on trade in goods declined to 15.3 billion euros from 16.5 billion euros in July. Since month-to-month changes in the balance of trade in goods tend to be erratic, we calculated six-month averages (using the "advance functions" button) to get a better idea of the trends in the two balances. On this basis, the trend in France's balance of trade in goods appears to be still toward greater deficits, while the trend in Germany suggests that the recent rise in surpluses may be decelerating, as can be seen in the first chart.
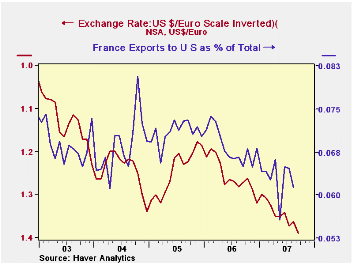
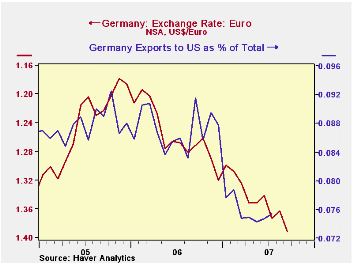
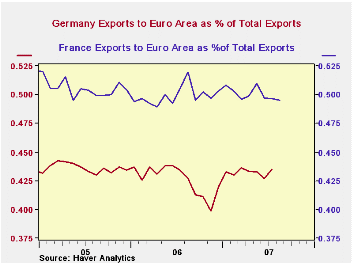
The rise in the Euro that began in late 2005 has led to a reduction in the portion of exports to the United States as can be seen in the second and third charts. These charts show the dollar value of the euro (scale inverted) and the portion of French and German exports to the United States. The relationship between the exchange rate and portion of exports appears to be closer in Germany than in France, but both show that an increase in the euro tends to dampen the portion of exports to the U. S. However, since exports to the US are a relatively small part of total exports in both countries, the impact on total exports has been small. The U. S. accounted for about 7% of total French exports in 2006. For Germany, the corresponding figure was about 9%. By far the most important buyers of French and German exports are other members of the Euro Area who are unaffected by changes in the currency. Over the past three years, between 40 and 45% of France's exports of goods and between 50 and 53% of Germany's exports of goods went to other members of the Euro Area, as shown in the fourth chart.


| TRADE IN GOODS--FRANCE AND GERMANY (Billions Euros) | Aug 07 | Jul 07 | Aug 06 | M/M Chg | Y/Y Chg | 2006 | 2005 | 2004 |
|---|---|---|---|---|---|---|---|---|
| FRANCE Balance | -2.8 | -3.2 | -3.0 | 0.4 | 0.2 | -27.6 | -22.7 | -5.0 |
| Total Exports | 34.7 | 34.0 | 32.5 | 2.0 | 6.6 | 389.6 | 357.5 | 340.9 |
| Exports to Euro Area | 17.2 | 16.9 | 16.9 | 1.7 | 1.6 | 194.4 | 180.7 | 173.9 |
| Exports to US | 2.1 | 2.2 | 2.1 | -3.2 | -1.8 | 26.4 | 25.1 | 23.0 |
| GERMANY Balance | 15.3 | 16.5 | 12.1 | -1.2 | 3.2 | 162.2 | 157.8 | 154.0 |
| Total Exports | 82.7 | 80.3 | 73.7 | 2.0 | 12.4 | 893.8 | 783.7 | 726.7 |
| Exports to Euro Area | 22.6 | 22.1 | 21.8 | -3.2 | -1.8 | 254.2 | 233.8 | 225.7 |
| Exports to US | n.a. | 6.1 | 6.3* | n.a.. | -4.0* | 78.0 | 68.8 | 94.1 |
| EXCHANGE RATE US$/Euro | 1.3626 | 1.3726 | 1.2810 | -0.7 | 6.4 | 1.2560 | 1.2447 | 1.2439 |
| *July 2006 n.a. not available | ||||||||
More Economy in Brief
 Global| Feb 05 2026
Charts of the Week: Balanced Policy, Resilient Data and AI Narratives
by:Andrew Cates


