 Global| Feb 01 2011
Australia: Business Confidence And Manufacturing PMI
Summary
Australia, barely recovering from the floods of the last two months, is now threatened with a devastating cyclone. The effects of the flooding are only beginning to be reflected in the country's statistics. The consumer price index, [...]
 Australia, barely recovering from the floods of the last two months, is now threatened with a devastating cyclone.
The effects of the flooding are only beginning to be reflected in the country's statistics. The consumer price index,
for example, has yet to reflect the price increases that will almost certainly follow from the reduction in the supply of
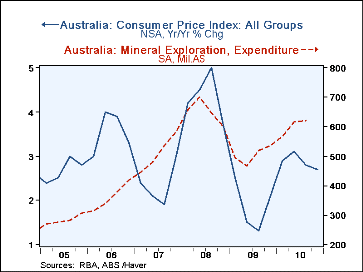
grains and sheep. The latest data for the CPI are for the fourth quarter of 2010 and show a year to year increase of only 2.7%.
In addition, expenditures on mineral exploration were still rising in the third quarter of last year, the latest data available.
Since then, the flooding has resulted in the closing of many coal mines. The year to year change in the CPI and expenditures on
mineral exploration are shown in the first chart.
Some idea of the effect the floods have had on business confidence was revealed today in the National Australian Bank' (NAB) measure of business confidence. The balance of opinion for December showed a sharp drop to -2.7% from one of +6.2% in November, as can be seen in the second chart.
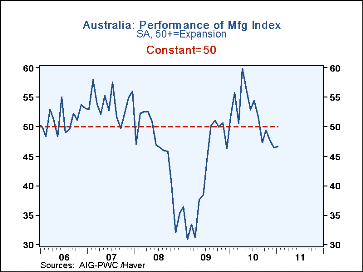
The most timely data on the effects of the flooding for the economy as a whole are probably the PMI types of series based on the opinions of purchasing managers. In Australia these are diffusion indexes called: Performance of Manufacturing (AUSPMI@ANZ), Performance of Construction (AUSVPKI@ANZ) and Performance of Service Industries (AUSPSI@ANZ). The Performance of the Manufacturing Industry is shown in the third chart. According to the properties of a diffusion index. values above 50% represent expansion and those below 50% represent contraction. According to the chart, the performance of the manufacturing industry has been in the contraction phase since August. No doubt, the flooding has played a large part in causing the contraction.
| Jan'11 | Dec'10 | Nov'10 | Oct'10 | Sep'10 | Aug'10 | Jul'10 | Jun'10 | |
|---|---|---|---|---|---|---|---|---|
| NAB Measure of Business Confidence (%Balance) | -- | -2.7 | 6.2 | 8.1 | 10.1 | 11.2 | 2.4 | 3.9 |
| Performance of Manufacturing (Over 50=Expansion) | 46.60 | 46.34 | 47.61 | 49.40 | 47.30 | 51.70 | 54.36 | 52.88 |
| Q4'10 | Q3'10 | Q2'10 | Q1'10 | Q4'09 | Q3'09 | Q2'09 | Q1'09 | |
| Y/Y Change in CPI | 2.7 | 2.8 | 3.1 | 2.9 | 2.1 | 1.3 | 1.5 | 2.5 |
| Expenditures on Mineral Exploration(Mil. A$) | -- | 619.7 | 615.7 | 565..6 | 535.6 | 519.4 | 162.9 | 494.7 |
More Economy in Brief
 Global| Feb 05 2026
Charts of the Week: Balanced Policy, Resilient Data and AI Narratives
by:Andrew Cates


