 Global| May 12 2006
Australia Home Financing Commitments Recoup 2004 Reductions
Summary
After some contraction in 2004, home finance in Australia has strengthened considerably. In data reported at midday May 12 in Canberra, the Australian Bureau of Statistics (ABS) indicated that housing commitments totaled 59,724 in [...]
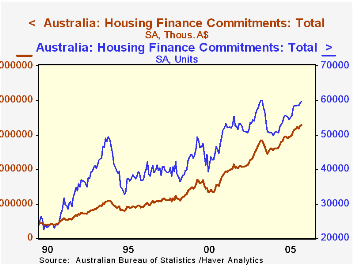
After some contraction in 2004, home finance in Australia has strengthened considerably. In data reported at midday May 12 in Canberra, the Australian Bureau of Statistics (ABS) indicated that housing commitments totaled 59,724 in March, up 423 from February and 7.5% from March 2005. The value of these commitments was A$13,124.4 million, up 11% from the year-earlier month.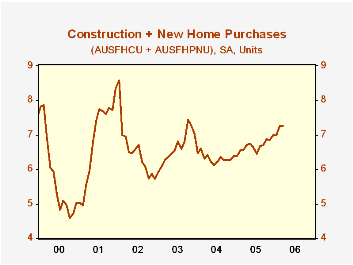
In the table below, we show the finance commitment data by purpose. We have combined it a bit differently than ABS presents. We added construction commitments to those for the purchase of new homes; this "new home financing" was nearly flat in March, up just 0.2%, but these commitments are up 10.5% from a year ago. ABS's measure of existing home purchase commitments includes those for refinancing, but we have pulled them out, so the entry in our table includes only actual purchases of "established dwellings". These financing commitments were up 0.9% for the month and 7.3% for the year.
The number of commitments for refinancing was 17,509 in March, 0.5% larger than in February and, moderating a bit, just 6.7% above March 2005. The volume of refinancing activity hit a peak during 2003, just a few months after a trough in interest rates, shown in the graph using 10-year Treasury bonds. Looking at this interest rate with a 6-month lead, we see a substantial 76% negative correlation with refinancing activity since 2000.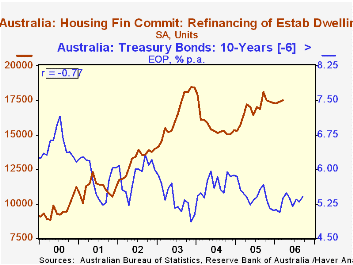
The number of existing home purchase commitments also peaked during 2003, and are only now re-approaching that amount.
These data are contained in Haver's ANZ database. All of the various calculations discussed above are made using DLXVG3. We can add or subtract two series and take growth rates on the newly constructed series, just as with the original ones. We can also edit the title to match the calculation, using the Graph dropdown menu item "Titles". Lead and lags in a series are implemented using CTRL together with the left- or right-arrow key.
| Australia: Housing Finance Commitments, SA | Mar 2006 | Feb 2006 | Jan 2006 | Mar 2005 | Monthly Averages|||
|---|---|---|---|---|---|---|---|
| 2005 | 2004 | 2003 | |||||
| Total Units (000s) | 59.72 | 59.30 | 58.46 | 55.57 | 56.11 | 51.18 | 56.66 |
| Value (Bil.A$) | $13.124 | $13.040 | $12.731 | $11.829 | $12.046 | $10.400 | $10.336 |
| Construction + Purchase of Newly Built Houses (000s) | 7.27 | 7.25 | 6.99 | 6.58 | 6.68 | 6.33 | 6.63 |
| Purchase of Established Houses (000s)* | 34.95 | 34.63 | 34.22 | 32.58 | 32.56 | 29.21 | 33.55 |
| Refinance of Established Houses (000s) | 17.51 | 17.42 | 17.26 | 16.41 | 16.86 | 15.64 | 16.48 |
Carol Stone, CBE
AuthorMore in Author Profile »Carol Stone, CBE came to Haver Analytics in 2003 following more than 35 years as a financial market economist at major Wall Street financial institutions, most especially Merrill Lynch and Nomura Securities. She had broad experience in analysis and forecasting of flow-of-funds accounts, the federal budget and Federal Reserve operations. At Nomura Securities, among other duties, she developed various indicator forecasting tools and edited a daily global publication produced in London and New York for readers in Tokyo. At Haver Analytics, Carol was a member of the Research Department, aiding database managers with research and documentation efforts, as well as posting commentary on select economic reports. In addition, she conducted Ways-of-the-World, a blog on economic issues for an Episcopal-Church-affiliated website, The Geranium Farm. During her career, Carol served as an officer of the Money Marketeers and the Downtown Economists Club. She had a PhD from NYU's Stern School of Business. She lived in Brooklyn, New York, and had a weekend home on Long Island.
More Economy in Brief

 Global| Feb 05 2026
Charts of the Week: Balanced Policy, Resilient Data and AI Narratives
by:Andrew Cates

