 Global| Oct 03 2006
Avoiding Pitfalls in Comparing Retail Sales Among Countries
Summary
Comparisons of retail sales among countries are beset by different definitions and by different units. Some countries report sales only in index form, others only in their national currencies. Some countries include sales of motor [...]

Comparisons of retail sales among countries are beset by different definitions and by different units. Some countries report sales only in index form, others only in their national currencies. Some countries include sales of motor vehicle and parts; others do not. Some counties report sales both including and excluding motor vehicles and parts.
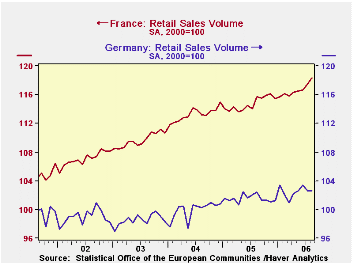
Today three countries--France, Australia and Hong Kong--reported retail sales. Yesterday Germany reported. The easiest comparison to make is between Germany and France. The volume of retail sales is reported in the EUROSTAT data base where concepts are harmonized. One can be reasonably certain that the difference in trends of retail sales in the two countries, shown in Chart 1, is a substantive one and not due to statistical quirks.
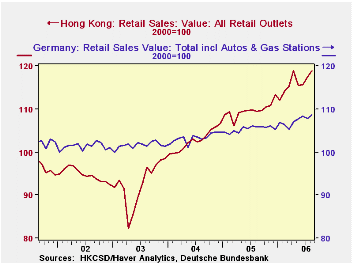
If one wishes to compare retail sales in Germany with those in Hong Kong one should note that the German concept excludes motor vehicles and parts while the Hong Kong concept includes them. Fortunately, however in the GERMANY data base, there is a memorandum item--Retail Sales including motor vehicle and parts. This series has a base of 2003 and the retail sales series in Hong Kong from the EMERGEPR data base has a base of October, 2004-September, 2005. One could change the Hong Kong index to base 2003=100 or, as we did change both to 2000=100 to be comparable with the other charts. The two series with base 2000=100 are shown in Chart 2.
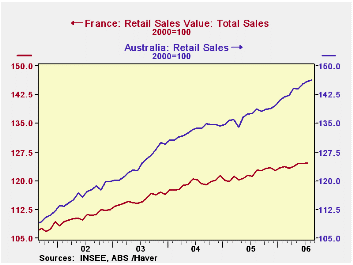
Another problem comes up when one series is in local currency and another in index form. Such is the case if one want to compare retail sales in France and Australia. The Australian data are given in millions of Australian Dollars, while the French data are given in terms of value and volume indexes. Both concepts, fortunately, exclude motor vehicles and parts. One simple approach is to take the Australian data from the ANZ data base, and, by using the advanced function, put the data in index form with 2000=100, the same base as the French value index that is found in the FRANCE data base.This comparison is shown in Chart 3.
The second and third charts, like the first show comparisons that reflect substantive differences and not statistical quirks.
| Retail Sales | Aug 06 | Jul 06 | Aug 05 | M/M % | Y/Y % | 2005 | 2004 | 2003 |
|---|---|---|---|---|---|---|---|---|
| GERMANY | ||||||||
| Vol Retail Sales, ex motor vehicles & pts (2000=100) | 104.3 | 104.3 | 104.1 | 0.00 | 0.19 | 103.2 | 101.6 | 100.2 |
| Val Retail Sales, ex motor vehicles & pts (2000=100) | 105.6 | 105.5 | 104.5 | 0.09 | 1.05 | 103.7 | 101.6 | 100.2 |
| Val Retail Sales, incl motor vehicles & pts (2000=100) | 107.1 | 106.3 | 104.4 | 0.75 | 2.59 | 103.9 | 101.8 | 100.2 |
| FRANCE | ||||||||
| Val Retail Sales, ex motor vehicles & pts (2000=100) | 116.3 | 116.1 | 114.1 | 0.68 | 2.25 | 114.7 | 113.2 | 109.7 |
| Vol Retail Sales, ex motor vehicles & pts (2000=100) | n.a. | 123.5 | 120.6 | n.a | n.a | 121.3 | 119.3 | 115.0 |
| AUSTRALIA | ||||||||
| Retail Sales (Mil A$) | 18.176 | 18031 | 17212.3 | 0.25 | 5.60 | 217396 | 198214 | 175956 |
| Retail Sales 2000=100) | 146.4 | 146.0 | 138.6 | 0.25 | 5.60 | 137.2 | 133.1 | 124.5 vA |
| HONG KONG | ||||||||
| Val Retail Sales (2000=100) | 118.8 | 117.4 | 109.4 | 1.20 | 8.61 | 109.6 | 102.7 | 92.6 |


