 Global| Nov 02 2010
Background Data For The G20 Summit In Seoul, November 11-12,'10
Summary
Imbalances in world trade are scheduled to be on the agenda at the upcoming meeting of the G20* in Seoul, Korea on November 11 and 12. The Haver data bases, EMERGE and G10, are good places to find background data pertaining to the [...]
 Imbalances in world trade are scheduled to be on the agenda at the upcoming meeting of the G20* in Seoul, Korea on
November 11 and 12. The Haver data bases, EMERGE and G10, are good places to find background data pertaining to the problem.
Among the Selected Major Indicators by Concept are current account balances as a percentage of GDP and current account and
trade balances in US dollars for the major developing countries in EMERGE and for the developed countries in G10.
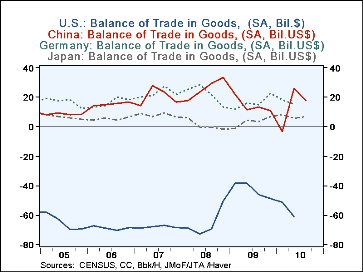
The major in imbalance in world trade over the past decade or so has been the large deficits on trade and current account of the United States and the growing trade and current account surpluses of the developing nations, particularly China. The first chart shows the recent development in the U. S. balance of trade and the balances of three of its major suppliers--China, Japan and Germany. After lessening in the first half of 2009, the deficit on the U. S. balance of trade has increased since then and in the second quarter of the year was $166.6 billion compared with a deficit of $120.3 billion in the first quarter of 2009. After subsiding from the end of 2008 to the beginning of this year, China's surplus on trade increased in the second and third quarters, Japan's balance of trade has gone from a deficit of $7.5 billion in the first quarter of 2009 to a surplus of $20.3 in the third quarter of this year. The German balance on trade has been relatively steady over his period, averaging about $50 billion.
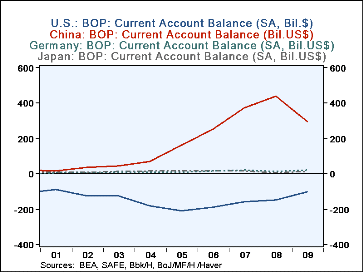
The second chart showing the annual current account balances of the same four countries over the past decade gives some perspective on the development of the imbalance. As the data for China are available only on an annual basis, any comparison we wish to make has be on an annual basis. While the annual data show some improvement in the U. S. deficit in 2008 and 2009, the more current data in the first chart suggest that the improvement has not carried over into this year.
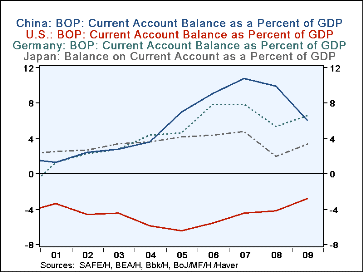
The third chart is also shown on an annual basis as a result of the unavailability of quarterly data for China. The three surplus countries show a decline in the current account as a percent of GDP in 2008 and 2009 from the peak in 2007 when the percent was 10.8% for China, 7.7% for Germany and 4.8% for Japan the four countries. At the same time the current account/GDP ratio for the United States has improved from -5.1%in 2007 to -2.7% in 2009.
These are only a few of the relationships that can be derived from the EMERGE an G10 data bases.
*The G20 include the nineteen countries: U.S., Canada, Mexico, Argentina, Brazil, U.K., Germany, France, Italy, China, Japan, South Korea, India, Indonesia, Saudi Arabia, Russia, Turkey, Australia, South Africa and a representative of the European Union.
| Balance of Trade (Bil. USD) | |||||||||
|---|---|---|---|---|---|---|---|---|---|
| Q3 10 | Q2 10 | Q1 10 | Q4 09 | Q3 09 | Q2 09 | Q1 09 | Q4 08 | Q3 08 | |
| United States | -- | -166.6 | -148.4 | -139.0 | -130.7 | -113.5 | -120.3 | -170.8 | -216.8 |
| China | 67.1 | 59.7 | 18.5 | 37.8 | 40.4 | 45.6 | 72.1 | 93.5 | 83.8 |
| Germany | -- | 46.1 | 47.9 | 65.1 | 48.1 | 43.4 | 32.9 | 47.0 | 62.9 |
| Japan | 20.3 | 15.1 | 21.6 | 19.6 | 10.3 | 6.5 | -7.5 | -6.8 | -1.7 |
| Balance on Current Account (Bil. USD) | |||||||||
| 2009 | 2008 | 2007 | 2006 | 2005 | 2004 | 2003 | 2002 | 2001 | |
| United States | -378.4 | -688.9 | -718.1 | -802.6 | -747.6 | -630.5 | -520.1 | -458.1 | -397.2 |
| China | 297.1 | 436.1 | 371.8 | 253.3 | 160.8 | 68.7 | 45.9 | 35.4 | 17.4 |
| Germany | 166.5 | 247.6 | 256.0 | 187.6 | 140.9 | 125.4 | 47.7 | 40.9 | 0.2 |
| Japan | 142.3 | 158.9 | 210.5 | 170.9 | 167.0 | 172.4 | 136.3 | 112.2 | 87.7 |
| Current Account/GDP (%) | |||||||||
| 2009 | 2008 | 2007 | 2006 | 2005 | 2004 | 2003 | 2002 | 2001 | |
| United States | -2.7 | -4.7 | -5.1 | -6.0 | -6.0 | -5.3 | -4.0 | -4.3 | -3.9 |
| China | 6.1 | 9.9 | 10.8 | 9.1 | 7.0 | 3.5 | 2.8 | 1.3 | 1.7 |
| Germany | 4.9 | 6.7 | 7.7 | 6.4 | 5.1 | 4.6 | 1.9 | 2.0 | 0.0 |
| Japan | 2.8 | 3.3 | 4.8 | 3.9. | 3.7 | 3.7 | 3.2 | 2.9 | 2.1 |


