 Global| Apr 28 2008
Brazil's Current AccountDeficit Widends
Summary
Brazil's has been recording a deficit on its current account for the last nine months after having recorded surpluses since 2002. In March the seasonally unadjusted deficit was $4,429 million US$, the largest in the last ten years, as [...]
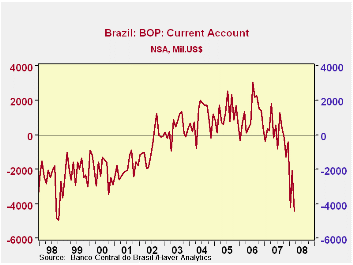
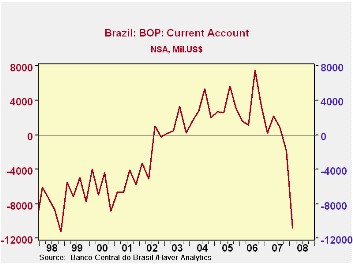
Brazil's has been recording a deficit on its current account for the last nine months after having recorded surpluses since 2002. In March the seasonally unadjusted deficit was $4,429 million US$, the largest in the last ten years, as can be seen in the first chart. The data are also shown on a quarterly basis in the second chart. In subsequent charts, we show the data on a quarterly basis to moderate the fluctuations in the monthly series.
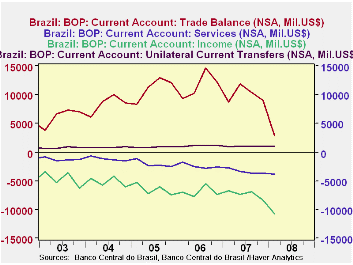
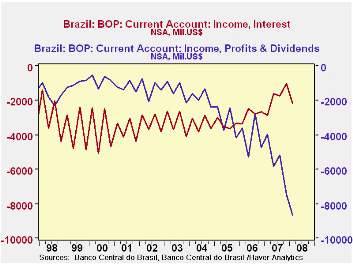
The major components of the current account are shown in the third chart. The positive trade balance that was the main factor in the current account surpluses of recent years, has been declining. In the first quarter of 2008, while still positive, was only $2,835 million US$ compared to a peak of $14,482 million US$ in the third quarter of 2006. Unilateral current transfers continue to be positive, but are small. The big negatives are the balances on services of -$3,845 and on income of -$10,736 million US$. The net outflow of profits and dividends on investments in Brazil has increased steadily, though irregularly since 2004 and net Income payments on debt have declined in recent years as can be seen in the fourth chart.
| BRAZIL:
CURRENT ACCOUNT B.O.P. (mil. US$) |
Q1 08 | Q4 07 | Q1 07 | Q/Q Chg | Y/Y Chg | 2007 | 2006 | 2005 |
|---|---|---|---|---|---|---|---|---|
| Total | -10,757 | -1,856 | 241 | -8,901 | -10,999 | 1,461 | 13,642 | 13,984 |
| Trade balance | 2,835 | 9,097 | 11,855 | -6,262 | -5,885 | 40,027 | 46,457 | 44,203 |
| Service balance | -3,848 | -3,672 | -2,723 | -176 | -1,125 | -13,355 | -9,641 | -8,309 |
| Income balance | -10,736 | -8,352 | -6,717 | -2,384 | -4,019 | -29,242 | -27,480 | -25,967 |
| Profits and Dividends | -8,662 | -7,450 | -3,962 | -1,210 | -4,697 | -22,435 | -16,369 | -12,686 |
| Interest Payments | -2,191 | -1,011 | -2,863 | -1,180 | -672 | -7,255 | -11,289 | -13496 |
| Remittances | 991.6 | 1,071 | 961 | -79 | 31 | 4,029 | 4,306 | 3,558 |
by Robert Brusca April 28, 2008
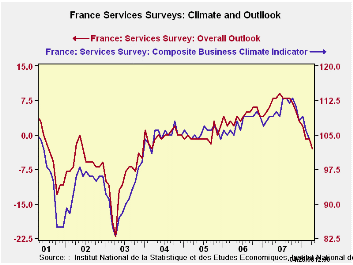
The French service sector climate indicator is down sharply in
the current month form 104 to 102 after being as high as 109 in January
to start the year. Service sector sentiment has been steadily eroding.
The climate indicator is in the 63 percentile of its range. The gauge
of employment expected in the next three months is lower in the 58th
percentile of its range.
The slip in the service sector is both steady and widespread.
France is coming off a period when the service climate has been in the
top 94th percentile of its range. But conditions in France have been
deteriorating rapidly. Morale and activity gauges from other large EMU
economies have been off peak. France itself is succumbing to these
adverse pressures. French Finance Minister Christine Lagarde said
Sunday that the Federal Reserve has a policy of very low interest rates
and the ECB has kept interest rates elevated and that the differential
in rates between the two is a little too big at the moment. This
continues a policy of being obliquely critical of the tight ECB
interest rate policy.
| France INSEE Services Survey Jan 2000-date | ||||||||||
|---|---|---|---|---|---|---|---|---|---|---|
| Apr-08 | Mar-08 | Feb-08 | Jan-08 | %tile | Rank | Max | Min | Range | Mean | |
| Climate Indicator | 102 | 104 | 106 | 109 | 63.3 | 51 | 113 | 83 | 30 | 102 |
| Climate: 3-Mos MAV | 104 | 106 | 108 | 109 | 68.7 | 48 | 113 | 85 | 28 | 102 |
| Climate: 12-Mos MAV | 109 | 110 | 110 | 110 | 94.1 | 10 | 110 | 91 | 20 | 102 |
| Outlook | -3 | -1 | -1 | 2 | 61.3 | 55 | 9 | -22 | 31 | -1 |
| Sales | ||||||||||
| Observed 3-Mos | 9 | 17 | 13 | 13 | 69.0 | 28 | 18 | -11 | 29 | 6 |
| Expected 3-Mos | 9 | 5 | 10 | 14 | 70.4 | 36 | 17 | -10 | 27 | 7 |
| Sales Price | ||||||||||
| Observed over 3-Mos | 5 | 1 | 1 | 1 | 75.0 | 2 | 8 | -4 | 12 | 0 |
| Expected over 3-Mos | 2 | 1 | 0 | 0 | 70.0 | 10 | 5 | -5 | 10 | 0 |
| Employment | ||||||||||
| Observed over 3-Mos | 11 | 17 | 17 | 7 | 78.6 | 9 | 17 | -11 | 28 | 4 |
| Expected over 3-Mos | 9 | 12 | 19 | 14 | 58.3 | 17 | 19 | -5 | 24 | 5 |
by Robert Brusca April 28, 2008
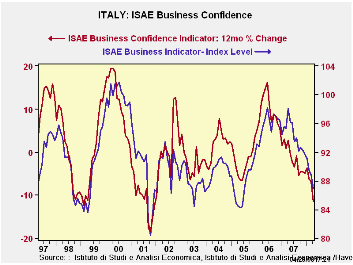
Italy’s Business confidence index is in the bottom 30 percent of its range since 1999. Orders are in about the bottom 25th percentile of their range. Orders for consumer goods are in the bottom 15 percentile of their range. Investment goods continue to be the strongest of the sectors and consumer goods in the weakest sector. The last period in which the business index fell more sharply was in 2001. The index was last lower in early 2005. Production is extremely weak for consumer goods and weak for investment goods. Investment goods production is in the 40th percent of range while consumer goods are in the 11th percentile of their range.
| Italy ISAE Business Sentiment | ||||||
|---|---|---|---|---|---|---|
| Since January 1999 | ||||||
| Apr-08 | Mar-08 | Feb-08 | Jan-08 | Percentile | Rank | |
| Biz Confidence | 86.9 | 88.8 | 89.5 | 91.1 | 30.4 | 84 |
| TOTAL INDUSTRY | ||||||
| Order books & Demand | ||||||
| Total | -19 | -16 | -13 | -8 | 23.8 | 78 |
| Domestic | -20 | -16 | -16 | -15 | 26.2 | 78 |
| Foreign | -20 | -17 | -17 | -11 | 29.5 | 62 |
| Inventories | 5 | 3 | 5 | 5 | 66.7 | 51 |
| Production | -14 | -11 | -13 | -12 | 26.5 | 81 |
| INTERMEDIATE | ||||||
| Order books & Demand | ||||||
| Total | -18 | -17 | -14 | -13 | 32.7 | 70 |
| Domestic | -19 | -16 | -14 | -17 | 34.0 | 68 |
| Foreign | -17 | -19 | -21 | -13 | 40.7 | 60 |
| Inventories | 6 | 4 | 4 | 3 | 72.4 | 15 |
| Production | -13 | -13 | -13 | -14 | 31.0 | 62 |
| INVESTMENT GOODS | ||||||
| Order books & Demand | ||||||
| Total | -13 | 1 | -4 | 1 | 38.4 | 59 |
| Domestic | -18 | -6 | -8 | -5 | 36.8 | 64 |
| Foreign | -14 | 0 | -8 | -1 | 33.9 | 60 |
| Inventories | 6 | 0 | 6 | 4 | 62.2 | 34 |
| Production | -4 | 3 | -4 | -1 | 40.9 | 45 |
| CONSUMER GOODS | ||||||
| Order books & Demand | ||||||
| Total | -23 | -22 | -23 | -18 | 13.6 | 92 |
| Domestic | -23 | -23 | -24 | -21 | 13.9 | 88 |
| Foreign | -26 | -20 | -18 | -24 | 19.1 | 89 |
| Inventories | 3 | 3 | 6 | 6 | 53.8 | 66 |
| Production | -21 | -18 | -20 | -17 | 11.1 | 96 |
| Total number of months: 118 | ||||||
More Economy in Brief
 Global| Feb 05 2026
Charts of the Week: Balanced Policy, Resilient Data and AI Narratives
by:Andrew Cates


