 Global| Sep 02 2008
Brazil's Industrial Production Points to a 5% Y/Y Increase in GDP in Q2
Summary
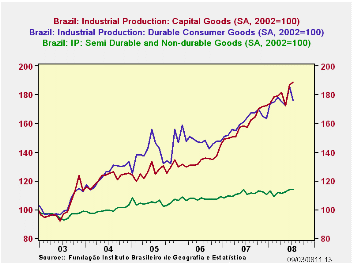
Brazilian industrial production rose 1% in July from June and was 7% above July, 2007. Capital goods production was up 20% over July 2007. Consumer durable goods production was up 7.5% and consumer semidurable and nondurable goods [...]

Brazilian industrial production rose 1% in July from June and
was 7% above July, 2007. Capital goods production was up 20% over July
2007. Consumer durable goods production was up 7.5% and consumer
semidurable and nondurable goods production was up 3%. The first chart
shows these major categories of total industrial production over the
past few years.
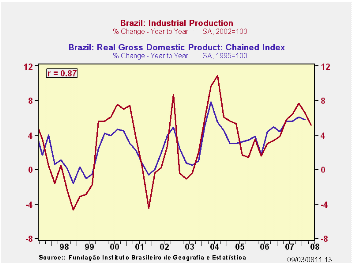
The quarterly year-to-year changes in industrial production have proven to be good indicators of the quarterly changes in real GDP as shown in the second chart where the correlation between the two series is .87 and the R2 is .76. The industrial production data precedes the GDP data by a month or more. The year-to-year increase in the second quarter industrial production was 5.1% down from the 6.6% of the first quarter when the year-to-year increase in GDP was 5.8%. If the correlation holds, we should expect a year-to-year increase of 5% second quarter increase of around 5% over the second quarter of 2007. The actual figure will be published September 10.
| BRAZIL: Industrial Production (2002=100) | Jul 08 | Jun 08 | Jul 07 | M/M % chg | Y/Y % chg | 2007 | 2006 | 2005 |
|---|---|---|---|---|---|---|---|---|
| Total | 130.63 | 129.28 | 121.63 | 1.04 | 7.40 | 121.29 | 114.98 | 111.79 |
| Capital Goods | 188.86 | 186.65 | 157.07 | 1.18 | 20.24 | 159.48 | 133.97 | 126.78 |
| Consumer Durable Goods | 176.22 | 185.81 | 163.93 | -5.16 | 7.50 | 160.92 | 148.13 | 139.99 |
| Consumer Semi and Non Durable Goods | 113.90 | 113.87 | 110.44 | 0.03 | 3.13 | 110.98 | 107.41 | 104.78 |
More Economy in Brief
 Global| Feb 05 2026
Charts of the Week: Balanced Policy, Resilient Data and AI Narratives
by:Andrew Cates


