 Global| Jun 27 2011
Business Confidence In The Netherlands Continues To Weaken In June
Summary
Business confidence in manufacturing in the Netherlands is measured by the difference between those who see improvement and those who see deterioration in the outlook. Until the recession of 2008, the difference had never been more [...]
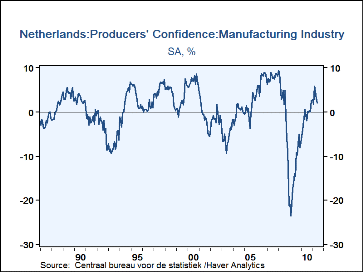
Business confidence in manufacturing in the Netherlands is measured by the difference between those who see improvement and those who see deterioration in the outlook. Until the recession of 2008, the difference had never been more than plus 9.4% or less than minus 9.4%, as can be seen in the first chart. During the recession, however, the indicator reached an excess of pessimists as large as 23.5% in February, 2009 and only slowly reached a positive balance of 0.3% in October 2010. The percent balance continued to be positive and reached an excess of optimists of 5.8% in March. Since then the excess of optimists has declined in each month by June was only 2.0%. The troubles in the periphery of the Euro Area, particularly in Greece, have no doubt affected business confidence in the Netherlands.
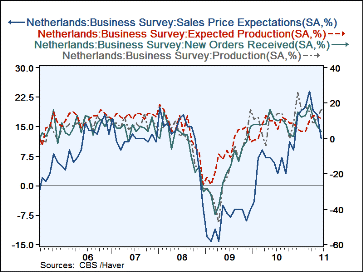
Trends among the major factors that determine confidence are shown in the second chart. While the trend in actual production is up in June to a 16% balance from 12% in May the trend in expected production is down, from a 13% balance in May to an 11% balance in June. The trend in new orders was down from a percent balance of 7 in May to one of 4 in June and the trend in sales expectations was down from an 18% balance in May to one of 12% in June.
| Netherlands | Jun 11 |
May 11 |
Apr 11 |
Mar 11 |
Feb 11 |
Jan 11 |
Dec 10 |
Nov 10 |
|---|---|---|---|---|---|---|---|---|
| Producer Confidence(%Bal) | 2.0 | 3.1 | 4.6 | 5.8 | 1.7 | 2.7 | 2.6 | 0.2 |
| New Orders Received (%Bal) | 4 | 7 | 12 | 19 | 13 | 12 | 15 | 1 |
| Production (%Bal) | 16 | 12 | 8 | 15 | 18 | 16 | 26 | 9 |
| Production Expectations(%Bal) | 11 | 13 | 13 | 10 | 4 | 4 | 5 | 9 |
| Sales Expectations(%Bal) | 12 | 18 | 19 | 24 | 20 | 19 | 18 | 9 |
More Economy in Brief
 Global| Feb 05 2026
Charts of the Week: Balanced Policy, Resilient Data and AI Narratives
by:Andrew Cates


